With the recent consultations on different dates for USD-LIBOR and other currencies LIBOR cessation, the discrepancy in spread computation mechanism has been discussed.
To our opinion, there will be no date discrepancy as we expect the LIBOR cessation announcement date to be the same for all currencies, even if the cessation date is not the same.
There are other more important inconsistencies. In the cross-currency market, there is the obvious LIBOR v (IBOR but not LIBOR). EUR-EURIBOR will not cease and the major cross, the one between USD and EUR, will be the prime example of this inconsistency.
But the other, less talk about, inconsistency that we want to point out in this post is the tenor inconsistency within a single currency. The spread for all tenors will be computed on the same day using a look-back period of 5 years. The period for all currencies is nominally the same 5 years, but those 5 years represent different economical realities for each tenor. The differences are coming from the fundamental flaw in the fallback spread methodology which is comparing a forward looking rate to a backward looking composition. To compare those two rates, you have by definition to use different dates. For LIBOR there is one fixing date while for the overnight, there is a tenor-full of dates.
Take the example of the USD-LIBOR-12M. Suppose that the announcement date is on 2021-01-05. What is the meaning of 5 years? This is the most recent 5 years of LIBOR fixing for which we have the corresponding 5 year of SOFR composition over the LIBOR tenor. The period starts on 2015-01-05 and finishes on 2020-01-05. The end is in 2020 and not 2021, even if the announcement is in 2021. This is not a typo but the impact of the in-arrears. To compute the spread, we need the in-arrears compounded on a 12 months period, i.e. the period from 2020-01-05 to 2021-01-05. This is a little bit more complex than that, because of the -2 business day shift in the fallback, but for this post we ignore it (all our data analysis and graphs are produced with the exact rules implemented in a production grade library).
But if we look at the same question for USD-LIBOR-1M, the LIBOR period is 2015-12-05 to 2020-12-05, a 11 month difference with USD-LIBOR-12M, i.e. almost 20% of the period is different. This is very significant when the economical situation is not stable. It turns out that the last 12 months have been very unstable from an economical perspective.
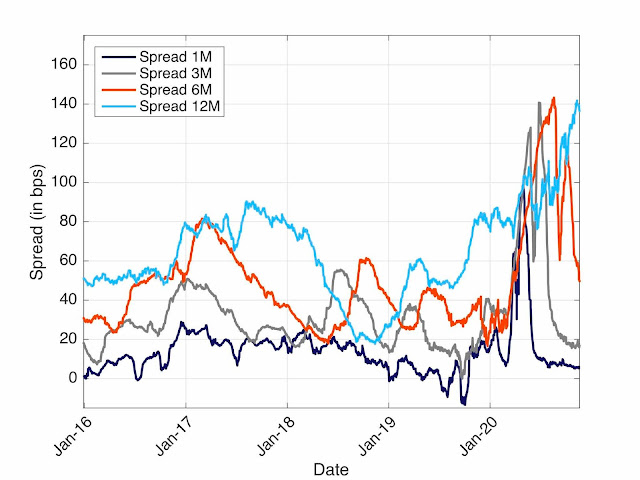
Let's look at it through the lens of the spread data. In Figure 1, we have represented the spread computed on a daily basis of the LIBOR/SOFR compounded in-arrears for tenors 1M, 3M, 6M, and 12M using the ISDA methodology.
Figure 1. Historical spread between USD-LIBOR and SOFR-compounded for different tenors.
Contrary to the intuition of the spread as being a credit spread, we see that the curves cross in several places. The 12M spread can be in some periods below the 6M and even the 3M spread. The April credit spread increase is clearly visible in the 1M, 3M and 6M spreads. Is it visible in the 12M curve? The answer is definitively no. The USD-LIBOR-12M data for the March/April period is not used, only the LIBOR data to 2020-01-05 is used. What is the spike seen at the end of the curve? This is the market misestimation of the monetary policy. SOFR, which closely follow monetary policy, over the last year crisis is strongly impacting the spread, but not for credit risk reason. The spread there is the "wrong" one if the goal is to represent the credit spread, it only represents the market inability to predict the future rates. Is what we want to represent in the spread? Usually a floating rate instrument is there to avoid the future's prediction. In this case, the spread represent the opposite of what we would like. A second spike will appear in the next 3 months and represent the credit spread effect.
This discrepancy can also be viewed in Figure 2.
Figure 2. Distribution of spread for USD-LIBOR-12M.
We have represented the distribution of the spread with the most recent data in a lighter colour. The recent spreads are high while today all the rates are low, the forward spreads are low due to the injection of liquidity by central banks and all short term historical spreads are low. The same economical reality produces completely opposite effects on different figures that are supposed to provide a fallback to the same LIBOR reality.
Recent related post: Historical spread adjustments: GBP figures, Historical spread adjustments: USD figures and CME steers away from ISDA fallback.
Fallback transformer series: LIBOR Fallback transformers!
If you want to be ahead in the transition game, contact us for LIBOR fallback and discontinuation: trainings, workshops, advisory, tools, developments, solutions.


