Thursday 25 August 2022

LIBOR transition: Back to LIBOR first - again and again!

Last week, we were saying "SOFR: slowly getting to SOFR First"; this week it seems we have to take that back. This week title is LIBOR transition:: Back to LIBOR first - again and again!, as reference to the "LIBOR Transition: Back to "LIBOR First" - again!" post from one month ago. The reason is the same, LIBOR appears very sticky. Each time the market seems to definitively move to SOFR first, LIBOR comes back with a vengeance and take over again. 

Figure 1: Weekly share by product types at LCH

The LIBOR return is visible both in LCH numbers displayed in Figure 1 and in ISDA-US regulatory numbers visible in Figure 2. In both cases, the weekly volume for LIBOR is above the weekly volume for SOFR.

Figure 2: Weekly SOFR volume at LCH and as reported by ISDA (US regulatory figures based).

At the outstanding amounts level, the picture is not very different. Over last week, outstanding LIBOR amounts have increased (slightly). The LIBOR volume is far from being "risk reducing". The outstanding SOFR volume is below its peak from 2 weeks ago as visible in Figure 3. 

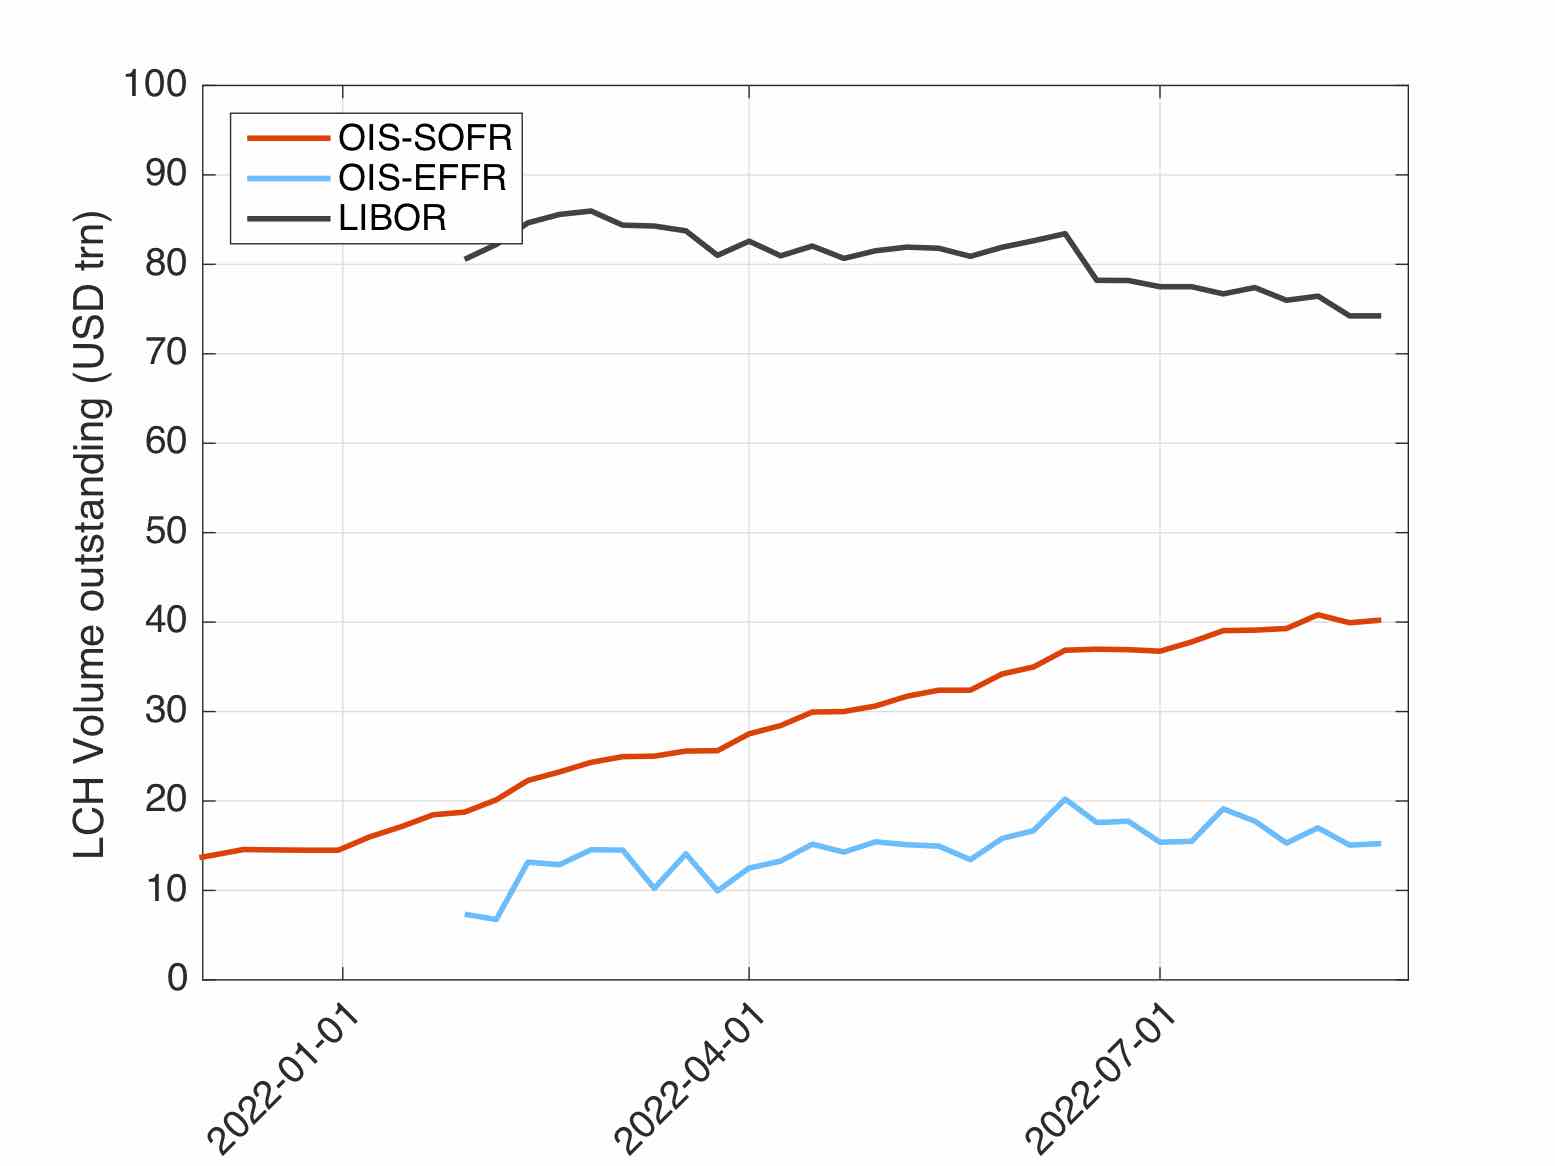
Figure 3: Outstanding amounts by benchmarks at LCH

More than 5 years after the "Future of LIBOR" speech, almost 18 months after the announcement of the definitive LIBOR dismissal and more than one year after the SOFR First announcement; LIBOR is back to the forefront.

Thursday 18 August 2022

SOFR: slowly getting to SOFR First

More than 5 years after the "Future of LIBOR" speech, almost 18 months after the announcement of the definitive LIBOR dismissal and more than one year after the SOFR First announcement; LIBOR is still traded in huge amounts. Only for last week LCH cleared IRS, there was 1.3 trillions USD traded.

But we see a slow progress. LIBOR volumes and outstanding notionals are slowly trending downward with some ups and downs; SOFR volumes and outstanding notionals are slowly trending upward with some ups and downs.

Figure 1: Weekly share by product types at LCH

Speaking of outstanding amount, the SOFR outstanding amount at LCH has decrease last week by 895 billions, the highest decrease ever. Nothing to be afraid of as there is a lot of short term products and they come naturally to maturity. But it may mean that we are approaching the "SOFR" peak. Note also that in term of outstanding amounts, SOFR is still well behind LIBOR with a 40 v 74 (trillions) score.

Figure 2: Outstanding amounts by benchmarks at LCH

Note that the "CME Conversion for USD LIBOR Cleared Swaps" rules have just been published. It means that since 2017, the market has been trading instrument linked to LIBOR, knowing that LIBOR would disappear and is only learning now what it has been trading for the last 5 years! Not a big success in term of transparency.

Monday 1 August 2022

SOFR: holiday and recession

It is difficult to get a clear message from a market which is half in holiday and half in recession. From the SOFR market, we could say, once more, nothing special to say.

The share of SOFR in the LCH cleared OTC IR market is playing ups and downs around one third of hte market. The changes are as much related to LIBOR and EFFR as to SOFR. The current SOFR share is not very different from the one mid-March.

Figure 1: Weekly share by product types at LCH

On the absolute volume, the holiday mood is clear, with the current weekly volume at merely 62% of the mid-June volume.

Figure 2: Weekly SOFR volume at LCH and as reported by ISDA (US regulatory figures based).

On the subject of LIBOR transition, we looked at the outstanding notionals at LCH in the different currencies. We noticed again a relation between the transition to overnight rates and the total outstanding notionals. Since the beginning of the year, all the currencies that have fully transitioned (GBP, CHF, JPY) have seen significant decreases (GBP -15%, JPY -42%, CHF -37%), the currency that has half transitioned (USD) is almost stable (+3%) and the currency that has not transitioned at all (EUR) has seen a significant increase (+19%). The origin of this relation is not clear. It can be completely random, or it can be that the end users have decrease their risk management program as the new overnight world does not fit their needs, or it can be something else. But certainly a trend to check in the future.