One month ago we published a blog titled "SOFR First - Step 1!". This was the fist week where at LCH there was more SOFR swaps traded than LIBOR swaps. We also indicated that for STIR futures at CME, LIBOR was still well above SOFR in volume terms.
This week we can indicate that "Step 1.5" in SOFR first has been reached. The daily volume of SOFR-3M futures is still less than the LIBOR-3M one, but for the first time, there was one day (Tuesday 19 April) where the combined volume of SOFR-3M and SOFR-1M surpassed on the LIBOR-3M one. You may have received some marketing email from CME indicated this milestone — even if the mail was not clear on the fact that this was achieved only by combining SOFR-3M and SOFR-1M. If you take the contract individually, LIBOR-3M has still more volume than SOFR-3M every single day. On the 1M side, EFFR-1M has still more volume than SOFR-1M every single day. This is why we call this step by the name of "1.5". The true "Step 2" will be when SOFR-3M volume is above LIBOR-3M volume and maybe "Step 3" when SOFR-1M volume is above EFFR-1M volume.
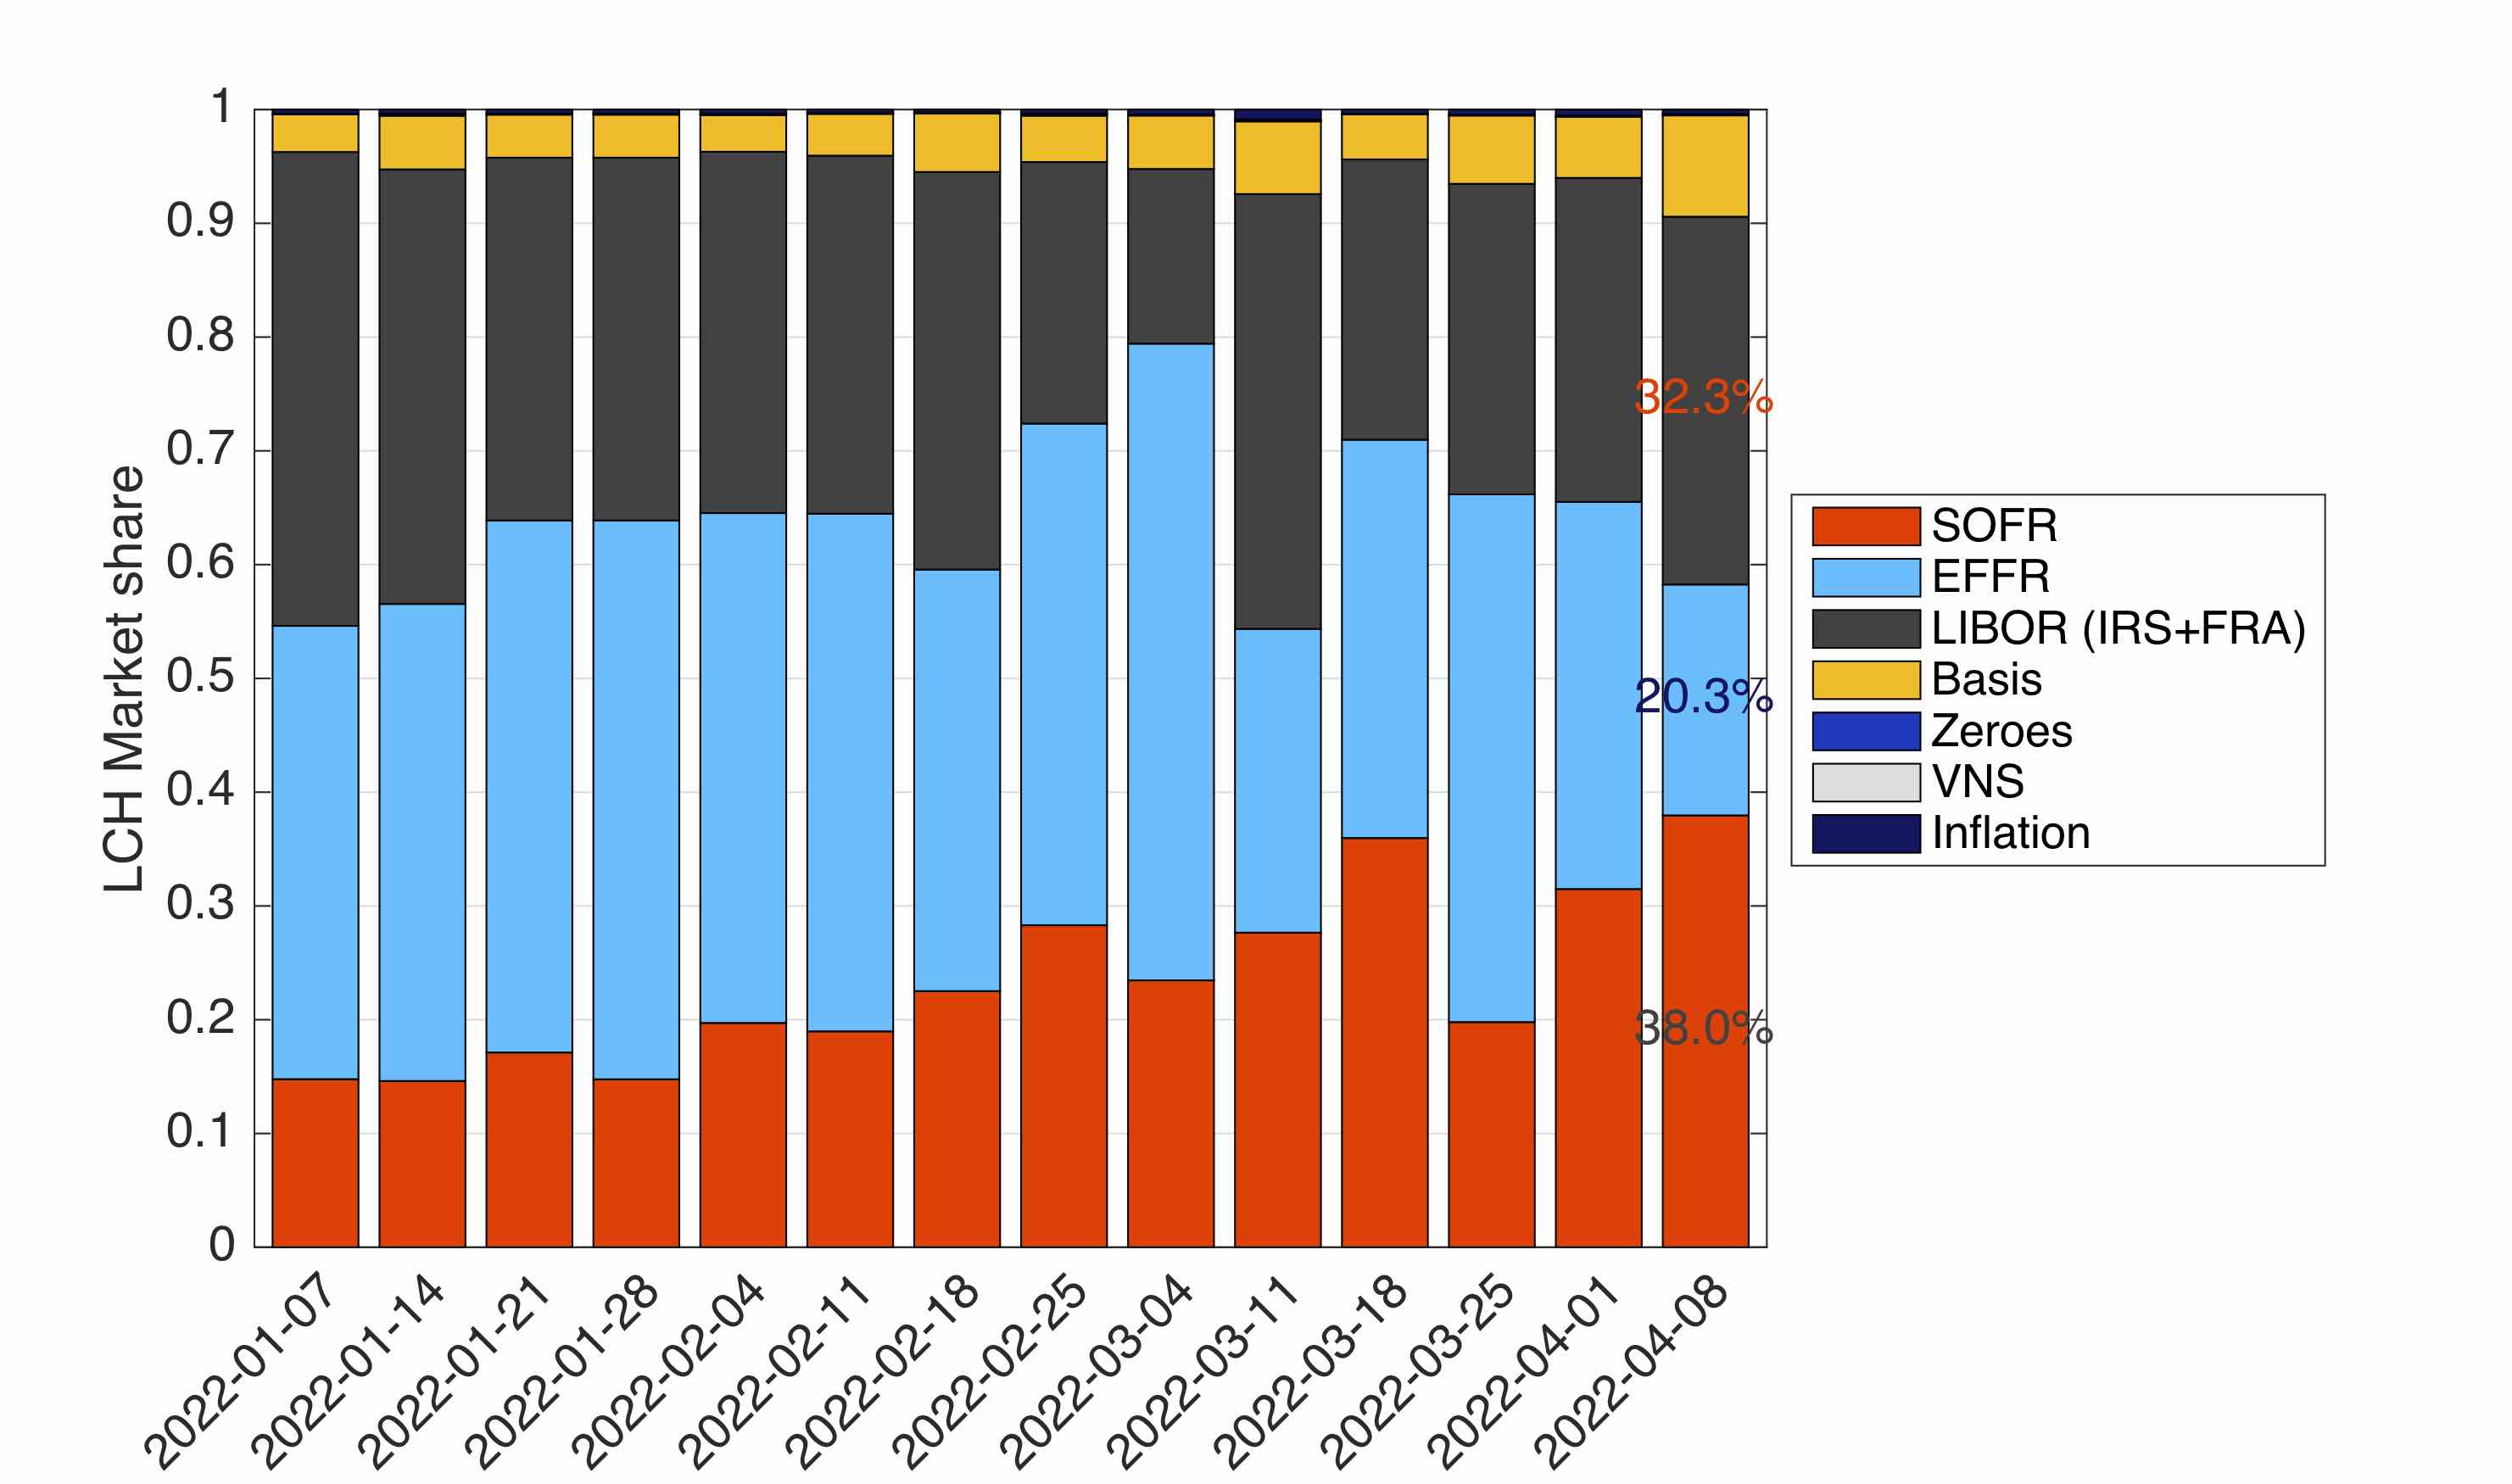
Returning to the LCH OTC cleared side, since that first "SOFR First - step 1" week, the SOFR, EFFR and LIBOR shares have battled for the leadership. The weekly shares are provided in Figure 1. SOFR hase been the main benchmark for a couple of weeks, but still far away from registering 50% of the OTC swap volume.

Figure 1: Weekly share of product types at LCH
The volume has been flat on an absolute basis over the last 8 weeks. The increase in market share is more due to the decrease in LIBOR and EFFR than the increase in SOFR.

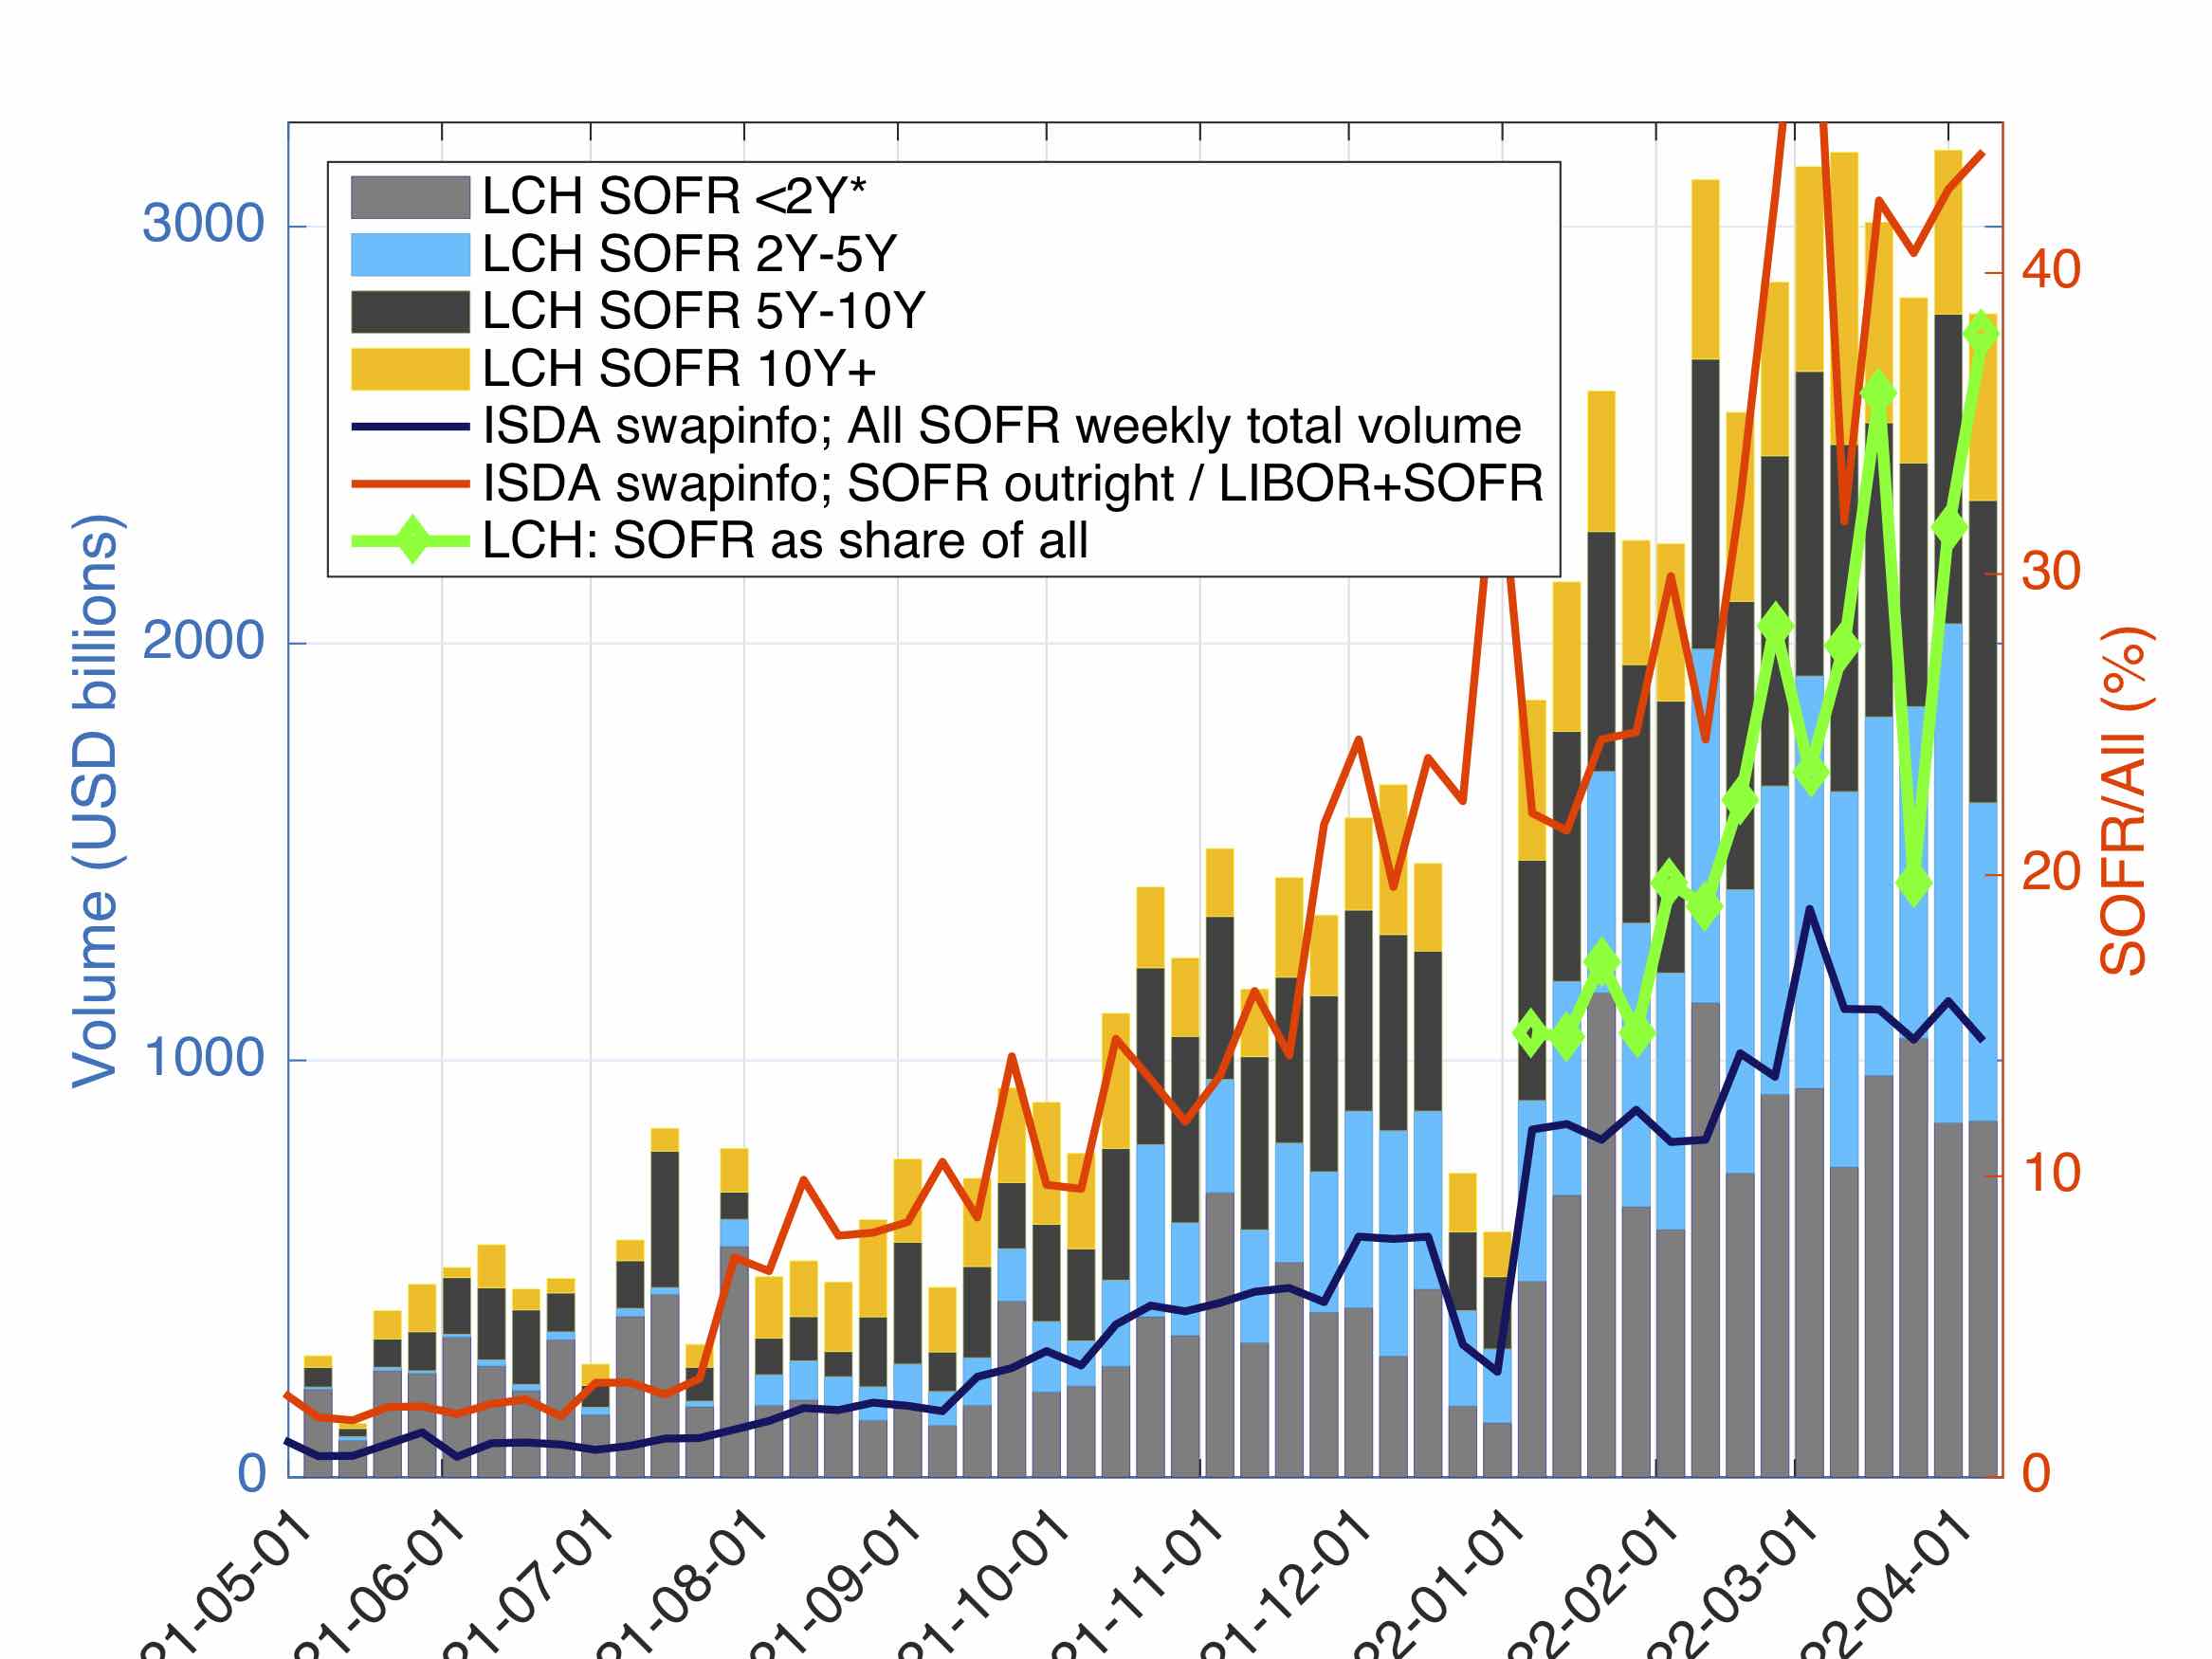
Figure 2: SOFR volume evolution and share among tenors.
The oustanding amount has been steadly increasing for SOFR and has now reached the EFFR level. The LIBOR outstanding amount is almost unchanged since the beginning of the year, confirming that the activity on LIBOR is not all risk reducing.

Figure 3: LIBOR, EFFR and SOFR outstanding volumes at LCH.
The daily volume in STIR futures at CME is displayed in Figure 4. The "Step 1.5" is not directly visible on the graph, but by adding the SOFR-1M to the SOFR-3M volume on 19 April, the totla is larger than the LIBOR-3M volume. Up to know, this was a one-off. We will indicate the real "Step 2" in our blogs as soon as we see it hapenning.

Figure 4: Daily futures volume at CME.
On the open interest side, the situation is a continuation of the developments since the begining of the year. An very small decrease in LIBOR open interest — indicating once more if needed that the vast majority of the LIBOR trades are not risk reducing — and a significant increase in the SOFR open interest and a smalller one in EFFR open interest. The OI in SOFR-3M futures has not reach 50% of the LIBOR-3M futures yet. The increase in SOFR and EFFR is probably linked in part to the change in monetary policy and not only to the benchmark transition. The total STIR futures OI has significantly increased since the start of the year.

Figure 5: Futures Open Interest at CME