2022 was suppose to be the year where USD-LIBOR was only used for risk reduction. The end of Q1 has come and that has not happen.
There has been progress on the LIBOR transition and on SOFR developments but they can only be qualified as "slow" and not all LIBOR transition goes in SOFR direction.
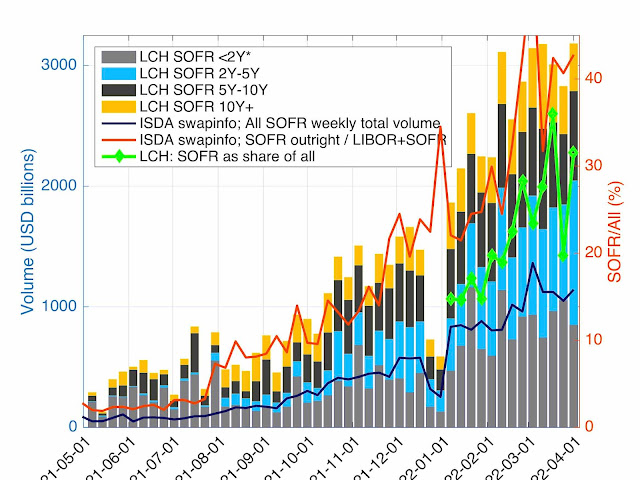
Let's start with the SOFR progress part. This is clearly visible in Figure 1 which displays the SOFR volume at LCH and as reported by ISDA (in Swap Info).
Figure 1: SOFR volume evolution and share among tenors.
The SOFR progress is clearly visible with the volume roughly tripling over the last 6 months.
On the LIBOR side, there has been a clear decrease in volume but far away of the one we would have expected from a"prohibition of new use" as decided by the FCA. Since the beginning of the year, the LIBOR volume represent roughly 31% of the USD 165 trn traded in USD derivatives at LCH. The weekly benchmarks shares are displayed in Figure 2.
Figure 2: Weekly share of product types at LCH
One obvious feature of the market share, is that is the USD derivative market is not based on a pure LIBOR-SOFR transition, but there is a third major participant: EFFR. Even without the support of the regulators and without the automatic conversion of some LIBOR trades, EFFR represent around one third of the market. The EFFR trades are concentrated on the short end of the curve.
As explained in previous blogs, this is a problem for SOFR as the term SOFR rates (CME and IBA version) are currently not based on "level 1 waterfall" — quoted OIS in the interbank market. It makes the pricing and hedging of those terms rates and the associated basis, which in theory should be 0, relatively difficult.
On the STIR futures side, the situation is not very different. SOFR is progressing and LIBOR is decreasing, but we are still very far way from a transition. EFFR is also playing a non-negligible role. The daily volumes over the last 6 months is displayed in Figure 3.
Figure 3: Daily volumes for STIR futures at CME.
We look at the STIR futures in two blocks: the 3 months futures and the 1 month futures. The 3 months are the most liquid and composed of three types: LIBOR, SOFR and BSBY. The daily share of SOFR has been between 12.4% and 42.5%, it has never been the most traded futures on any single day. The share of BSBY is anecdotic, between 0 and 1%. LIBOR is still by far the dominant futures with more than 70% of the average daily volume. The 1 month is composed of only two types: SOFR and EFFR. The daily share of SOFR is between 8.3% and 29.7%. Fed Funds futures are still largely dominating SOFR with with around 85% of the average daily volume.


