Wednesday, 30 March 2022

Oops! Back to SOFR third!

Last week we reported the first "SOFR First" week, at least in term of volume at LCH. This week we are already back to "SOFR Third" as displayed in Figure 1. The SOFR share fell significantly to 19.8% from 36.0% while EFFR increased to 46.4% and LIBOR to 27.3%. In DV01 terms the shares may be different as a lot of the EFFR trades are shorter term.

Figure 1: Weekly share of product types at LCH

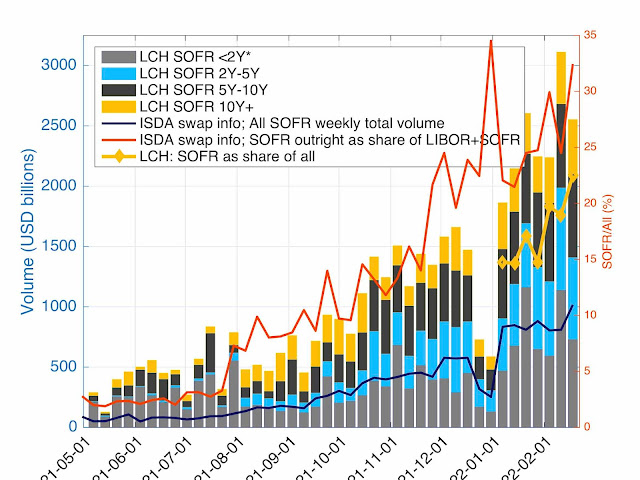
The large changes in share are due to a slight decrease in SOFR trading but significant increase in EFFR and LIBOR trading as displayed in Figure 2. The ISDA/US regulatory figures also display a decrease in SOFR share.

Figure 2: SOFR volume evolution and share among tenors.

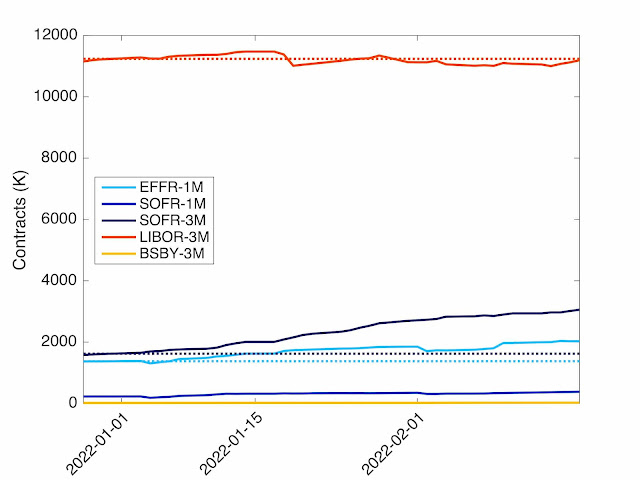
In absolute terms for the outstanding amounts, SOFR is also third as displayed in Figure 3. The only slightly positive note for SOFR is the continuous increase in outstanding amounts at LCH while LIBOR outstanding amounts have been decreasing for the last 4 weeks.

Figure 3: LIBOR, EFFR and SOFR outstanding volumes at LCH.

Tuesday, 22 March 2022

"SOFR First" - Step 1!

Finally, 5 years after the "The future of LIBOR" speech, 1 year after the death date announcement, more than 6 months after regulators "SOFR First" announcement, we have reach the first step in "SOFR First". "SOFR First" is for the first time a reality in LCH cleared weekly volumes. The SOFR first is still very partial as it does not appear in ISDA/US regulatory or in CME futures figures.

On LCH side, SOFR is first with 36.0%, EFFR second with 35.0% and LIBOR third with 24.6%. SOFR has a relative majority, slightly above one third of the volume but still far from an absolute majority. On the US regulatory figure, outright SOFR is 42.4% of a total that does not include EFFR (not reported in ISDA figures). The change of volume share is mainly due to the decrease in LIBOR and EFFR volume; the SOFR volume is practically unchanged over the last 5 weeks.

Figure 1: Weekly share of product types at LCH

Last week also saw the launch of the ICE Term SOFR Reference Rates. There was already a SOFR Term rate, administered by CME, but to our opinion that benchamrk is less convenient. The CME benchmarks are based on futures prices and obtained through some arbitrary intepolation mechanism and some weighted average over the day while the ICE benchmarks are based on actual market prices for the given tenors at a given point in time.

This lead to Figure 2, where the volume of SOFR swaps and its split by tenor is displayed. We can see the trend already mentionned in previous blogs (e.g. here) which is that with respect to other overnights benchmarks, the share of short term swaps is relatively low. The volume in the USD OIS short term market is mainly in EFFR-OIS. The liquidity is not there yet to use level 1 inputs in the benchmark waterfall. Level 1 inputs are "eligible, executable prices and volumes for relevant and eligible overnight interest rate swaps referencing the relevant RFR, provided by regulated, electronic trading venues". For the moment only Level 2 inputs, i.e. "eligible dealer-to- client prices and volumes".

Figure 2: SOFR volume evolution and share among tenors.

The outstanding volume continue to decrease slighlty for LIBOR and increase for SOFR.

Figure 3: LIBOR, EFFR and SOFR outstanding volumes at LCH.

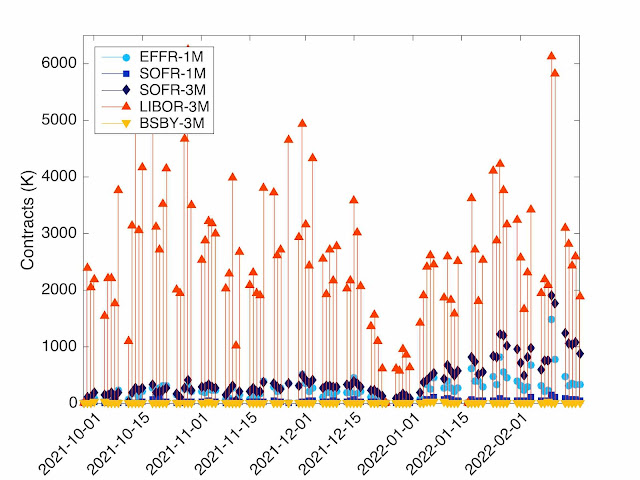
On the futures side, we are still far away from SOFR First. LIBOR is still the dominant force, both in terms of daily volume (Figure 4) and open interest (Figure 5). Over last week the market share at CME was LIBOR-3M at 53.7% (2.4 m ADV), SOFR-3M at 32.7% (1.5m ADV), EFFR-1M at 11.4%, SOFR-1M at 2.2% and BSBY at 0.1%. There has not been a single day where SOFR-3M volume was above LIBOR-3M volume. On the futures side, we are still waiting the "SOFR First" first day. On the one month contracts, EFFR is well above SOFR-1M, a market feature parallel to the swap market where short term EFFR-OIS dominated SOFR-OIS.

Figure 4: Daily futures volume at CME.

The open interst is almost unchanged for LIBOR since the start of the year, with only a small dip on 15 March with the expiry of the March contracts. The SOFR-3M open interests continue to increase and also dipped at mid-month (on 17 March, due to a different expiry mechanism).

Figure 5: Futures Open Interest at CME

New published paper: Swap Rate: cash settled swaptions in the fallback

We are pleased to announce that the research paper written by Marc and titled

Swap Rate: cash settled swaptions in the fallback

has been accepted for publication in Risk. The publication date will be announced later.

The preprint version of the paper is part of the muRisQ Advisory Model Development series of research papers. The paper results have been presented in different seminars and conferences, including the The 4th Interest Rate Reform Conference on 20 October 2021.

Abstract

With the planned cessation of LIBOR, the LIBOR-based Swap Rates will also cease. For legacy transactions linked to it, a fallback is required. Some approximated fallback mechanisms have been proposed by working groups. The approximations involve some non-linear function of overnight-based swap rates. Due to the non-linearity, cash settled vanilla swaptions are becoming exotic products. Moreover, keeping the annuity unchanged while changing the rate to overnight-based swap generates technical issues in the pricing leading to convexity adjustments. The article proposes different pricing methodologies for those now exotic swaptions, including several price approximation to reduce the implementation numerical complexity.

Tuesday, 15 March 2022

USD Benchmark transition: LIBOR-SOFR criss-cross continues

LIBOR fight not over: LIBOR retakes the lead in front of SOFR at LCH.

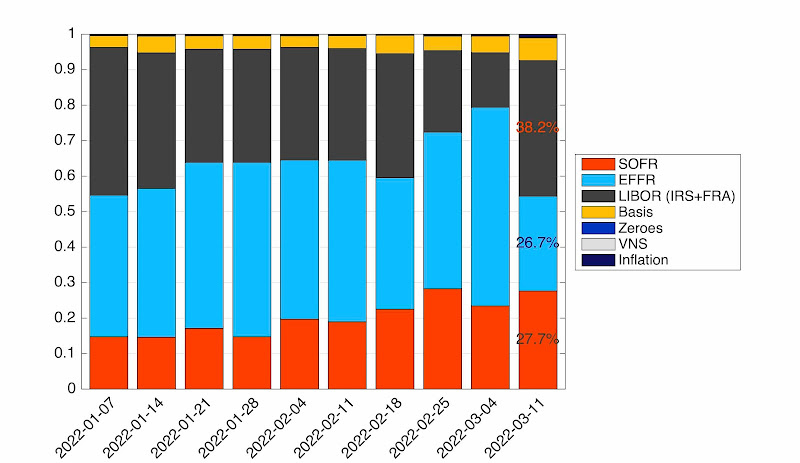
Two weeks ago, SOFR overtook LIBOR in volume terms at LCH for the first time. Last week, LIBOR took back the lead by a wide margin — 38.2% for LIBOR versus 27.7% for SOFR. Similar trend is visible in the ISDA/US regulatory figures where LIBOR is almost the double of SOFR in volume terms (1,874 bn v 952 bn).

Figure 1: Weekly share of product types at LCH

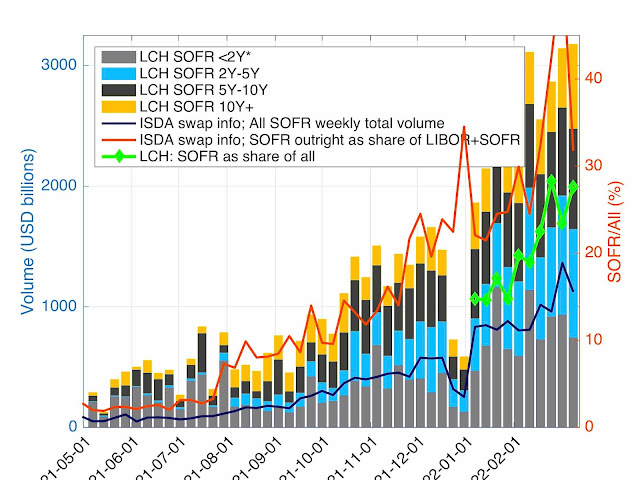
Figure 2: SOFR volume evolution and share among tenors.

In terms of outstanding amounts, the LIBOR instruments are almost unchanged. No real LIBOR risk reduction visible at this stage.

On the futures side, LIBOR remains firmly in the lead, even if that lead has been eroded.

Figure 3: Volume in some STIR ETD futures at CME since October 2021 (in thousands of contracts).

Tuesday, 8 March 2022

LIBOR peak?

Last week, the LIBOR share at LCH has continued its decrease and is now just above 15%. On the week, the SOFR share has also decrease to 23.5% (from 28.3%). The weekly winner is certainly EFFR with a 56.0% share. See Figure 1 for the history.

Figure 1: Weekly share of product types at LCH

SOFR share is for the second week above LIBOR and one can expect this trend to continue.

On the absolute volume side, SOFR has reach its higher level ever at USD 3,144 bn, just above the record from 3 weeks ago. See Figure 2 for more details.

Figure 2: SOFR volume evolution and share among tenors.

The ISDA reported figures (reported under US regulation) also showed a large relative increase of SOFR with respect to LIBOR (unfortunately, the spreadsheet was not updated on ISDDA Swap Info website). But they do not show the EFFR figures in the same data set. It is difficult to see if the international trend related to EFFR visible at LCH is also true domestically in the US.

What is also interesting is to follow the outstanding amounts. They allow us to see if the LIBOR activity is risk reducing or not. We know that SOFR outstanding amounts are increasing as this is a relatively new benchmark and the BAU level has not been reach yet. What about LIBOR? Do we see a significant decrease? The answer is partly in Figure 3. LIBOR still dominates largely (above USD 80 trn v around USD 25 trn for SOFR). Moreover, even if the outstanding amount has slighlty decrease last week, there is no clear downward trend (even an increase since end of January). But with last week decrease, we may have reached "LIBOR peak"! The coming weeks will tell us if this is the case. On the outstanding amount side, EFFR is also above SOFR.

Figure 3: Outstanding amounts at LCH.

Wednesday, 2 March 2022

USD STIR Futures - first 2 months of 2022

ETD STIR Summary: SOFR progresses, but LIBOR still dominates.

In our weekly review of USD interest rate OTC volume, we reported that for the first time last week, the volume of SOFR products was over the volume of LIBOR products — even if still below the volume of EFFR products. On the ETD STIR side, SOFR continues to progress but has certainly not yet reach the LIBOR level. The SOFR 3M futures were last week at 28.1% of the total STIR futures for 59.8% for LIBOR - and 10.3% for EFFR 1M, 1.8% for SOFR 1M and 0.1% for BSBY. The daily volumes for the past couple of months are reported in Figure 1.

Figure 1:Volume in some STIR ETD futures since October 2021 (in thousands of contracts).

The steady progress of the SOFR daily volume is clearly visible since the start of 2021. LIBOR is supposed to be used only for risk reduction. Is this what is happening in the futures market? The answer can be seen in Figure 2 displaying the open interest for the different contract types. Since the start of the 2022, the LIBOR Futures OI is virtually unchanged, even if a couple of serial contracts have expired since. The volume does not correspond to risk reduction.

Figure 2: Open Interest in STIR ETD options since the start of 2022 (in millions of contracts).

We also provide some figure related to the options on futures. As reported in a recent blog, the options on SOFR futures have started to trade, but for options, the lag is even more important than for futures. The daily volume up to 1 March is provided in Figure 3.

Figure 3: Volume in some STIR ETD options since the start of 2022 (in thousands of contracts).

Even if there is some progress, the SOFR volume is still barely visible on the graph. The total volume of SOFR options is below the volume of the LIBOR 2-year mid-curve options, which are the third level of LIBOR options. As explained in previous blogs, those 2-year mid-curve options will be converted to SOFR mid-curve options. Potential explanantion for this choice by the market were discuss in the blog SOFR ETD options: Finally some activity.

Figure 4: Open Interest in STIR ETD options since the start of 2022 (in millions of contracts).

At the level of open interests, the SOFR progress is visible, but it is drarf by the LIBOR progress. Since the start of 2022, the open interest in LIBOR options has increased by 9 millions contracts while the SOFR options side has increased by 0.9 million contracts. The increased interest in the options is most probably related to the uncertainty about the monetary policy. Monetary policy watchers appear to express their volatility views through the LIBOR options instead than through the SOFR options. This is somehow similar to the linear products where monetary policy watcher appear reluctant to express their view through SOFR and do it through EFFR (see here).

Tuesday, 1 March 2022

USD: Is LIBOR transition starting?

Almost five year after the notorious The Future of LIBOR speech, is the "lack of there of" part actually starting in the USD market?

The evolution away from LIBOR had to go through three phases (not necessarily disjoint): preparation, actual transition and disposal.

  1. Preparation: decide what we don't want - LIBOR in this case -, what we want (SOFR), when we want to do it, what are the new products required (futures, ois, in-arrears loans, term rate, etc.), plan for the disposal,
  2. Transition: the actual part of it, trade mainly the new stuff and stop trading the old LIBOR, except to initiate the disposal of old tools
  3. Disposal: the cleaning part, including fallback, agreements to cancel/transform the old toys, etc.

The preparation started slowly from 2017, a good part came at the start of 2021 with the ISDA fallback decisions. But up to now we have been far away from the actual transition. The new benchmark, SOFR, has been far away from being first as claimed by the different "SOFR First" initiative. Up to the week before last, we regularly reported on the "SOFR Third" truth. This is changing. We are still far from actual SOFR first, but there is clear signs of it being possible in the near future.

In Figure 1, we display our usual shares of SOFR, EFFR and LIBOR at LCH, currently the main clearing house for USD interest rate products. For the first time, the SOFR share is above the LIBOR share with 28.3% versus 23.0%. SOFR is still not at the first place as EFFR is leading with 44.1%. There is a general decrease in LIBOR volume but it does not go all to SOFR.

Figure 1: Weekly share of product types at LCH

We also provide the SOFR volume in absolute volume in Figure 2. Over the last weeks, SOFR has not really increased, with the volume of the week ending on 11 February still the highest. The change has to be attributed to a decrease of LIBOR, not an increase of SOFR.

Figure 2: SOFR volume evolution and share among tenors.

This lead us to some remark on the tenor distribution of SOFR swaps. In Figure 2 the share between the different tenor ranges is also provided. We focus on that part for the 8 first weeks of 2022 in Figure 3 and we add the same numbers (same scale, same colors) for ESTR.

Figure 3: Share by tenor for SOFR and ESTR.

What comes out clearly in this comparison is not really that the volume of SOFR is smaller but that the short term part is significantly smaller. With the expectations of monetary policy changes, the short term volume (gray in the figures) increased significantly for ESTR but not for SOFR.

This is a problem in the building of the Term SOFR that would be useful for the transition and fallback. Remember that GBP and JPY LIBOR have now a synthetic version based on Term SONIA and TORF. The CHF does not have a term SARON and the EU regulation had to invent a tortuous way to deal with this absence. One may argue that there is already a Term SOFR, but it is based on futures, uses arbitrary interpolation scheme and is not using point-in-time fixing mechanism; it is not ideal for hedging and difficult to replicate in the market. The large part of the EFFR volume is probably on the short term. SOFR is replacing LIBOR as a long term interest rate risk management tools but does not seems to win the heart of market participants as a monetary policy risk management tool.


Note (2022-03-02): A first version of the Figure 3 graphs were missing the last two weeks. The graphs have been updated.

Monday, 21 February 2022

LIBOR to SOFR transition: weekly LIBOR share increases

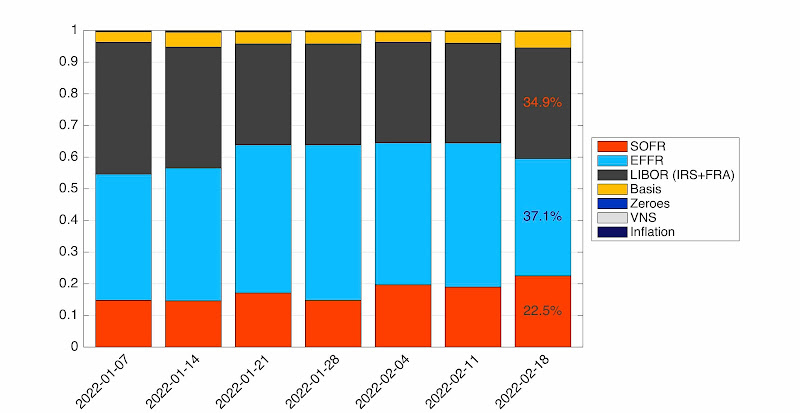
Another week in the LIBOR transition, another set of puzzling statistics. Over the last week (week ending 2022-02-18), the total volume in SOFR swaps has decrease by around USD 550 billions. On an relative basis, the share of SOFR swaps has increased by 3.48%, but the share of LIBOR swap has increased even more by 3.54%. The decrease in share is mainly attributed to EFFR.


Figure 1: Market shares for the different benchmarks at LCH in 2022.

Once more, the large LIBOR volume cannot be attributed to risk reducing trades. The outsranding LIBOR swaps have increase by USD 980 billions (USD 943 billions if we add IRSs and FRAs). The outstanding SOFR swaps have increased only by USD 952 billions.

Once more, we have some difficulty to interpret those figures in the grand scheme of the USD interest rate benchmark transition.

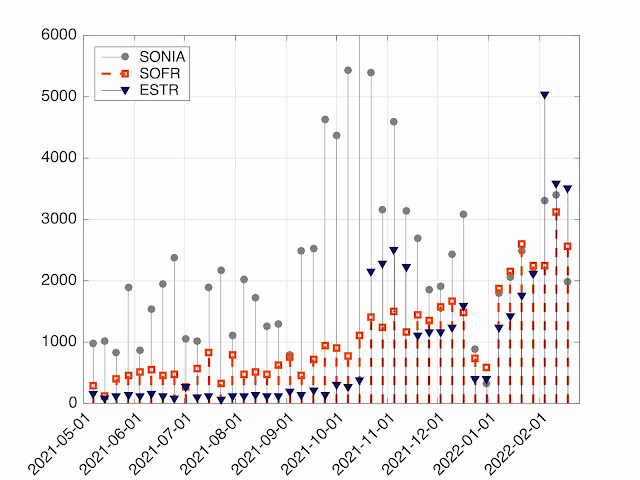
We are also adding the relative size of the new overnight benchmarks in the different currencies (GBP-SONIA, USD-SOFR, EUR-ESTR). The volume of SOFR is roughly at the same level as ESTR and SONIA (lower most of the weeks), even if of relative total volume year-to-date with respect to the USD,  for EUR is less than 50% and GBP is less than 20%.

Figure 2: Comparison of weekly volume between SONIA, SOFR and ESTR.


Added 2022-02-22:

The US figures (as reported by ISDA based on US regulatory reporting) indicate a slightly different trend than the worldwide figures (as reported by LCH). In both cases, little change from one week to another, but US figures indicate a slight increase in SOFR and a slightl decrease in LIBOR while the worldwide figures indicate the opposite.

Figure 3: Weekly volume at LCH and as reported by ISDA.

Sunday, 20 February 2022

SOFR ETD options: Finally some activity

2022 was supposes to be the "no more LIBOR and SOFR First year". As described in our recent blogs, this has not been the case over the first weeks of 2022 for clear OTC swaps or for ETD futures. In both cases, LIBOR still largely dominates SOFR and in the cleared OTC case, even EFFR dominates SOFR.

Up to now we have not mentioned ETD STIR options (options on futures). The reason for the absence in our blogs was their absence in the market. This is changing.

Over the last weeks, the volume of SOFR futures options has exploded, from completely invisible to barely visible. It may sound like an oxymoron to start the sentence with "exploded" and finish it with "barely visible", but the following graphs and figures will justify it. Let's start with the "barely visible" part in Figure 1. It represents the volume of some STIR options. In the different blue shades are LIBOR options and in the red/yellow SOFR options: we report only the main types: quarterly and yearly mid-curve (MC). The SOFR options represent 2.5% of the total over the past week.

Figure 1:Volume in some STIR ETD options since the start of 2022 (in thousands of contracts).

To justify the "exploded", we notice at the open interest (OI) in SOFR options has been multiplied by more than 100 since 3 January (from 7,772 to almost 800,000).

The volume shares for the week ending 2022-02-18 are LIBOR 97.5% (Quarterly 66.4%, MC 1Y: 21.3%, MC 2Y 6.1%, MC 3Y: 3.6%, MC 4Y: 0.1%) and SOFR 2.5% (Quarterly 1.5%, MC 1Y: 1%).

Like for the futures we have reported in the previous weeks, the LIBOR volume does not come from reduction of risk and removal of exiting positions. The OI in the different option types is provided in Figure 2 (same color code as above).

Figure 2: Open Interest in STIR ETD options since the start of 2022 (in millions of contracts).

The SOFR OI increase appears at the bottom of the figure and the even larger increase in LIBOR appears at the top. To show the increases in the different types, Figure 3 provide the OI change with respect to 3 January 2022.

Figure 3: Change in Open Interest in STIR ETD options since the start of 2022 (in millions of contracts).

The OI increase is visible for all types, with the quarterly LIBOR options pre-eminent. The increase in volume is probably in large part related to the expected changes in monetary policy in the US and its associated volatility and not related to LIBOR transition.

As usual a natural question is: Why trading LIBOR futures options? Most of the options will be converted at some stage before expiry to equivalent SOFR futures options. The products are for a large part SOFR options in disguise. Potential answers to the questions are:

  1. Ignorance: Participants do know about the coming transition.
  2. Lack of validation: Traders are perfectly aware that they are trading SOFR options but somehow the direct SOFR products are not accessible to them. This can be due to lack of model validation of the pricing of the SOFR products while the institution is still relying on a old (pre-transition) validation of LIBOR products. It can also be to lack of limits on those new products.
  3. Play on non-transition: Some players expect the LIBOR-SOFR transition in the futures and their options not to take place as expected (delayed transition, change of spread, legal issues, etc.)
  4. Liquidity: Liquidity calls liquidity. Because all the current liquidity is in LIBOR futures, nobody want to transact in SOFR products, even if they are equivalent, by fear of paying to much to enter and being stuck with the options without possibility to exit at a decent price.

Maybe we have missed on some other potential answers. Don't hesitate to send us your explanation, we will add them in the next blogs.

Our opinion about the potential answer above are:

  1. Ignorance: To our opinion, this is extremely unlikely and we mention it only for completeness.
  2. Lack of validation: SOFR futures products are technically more complex than LIBOR futures sue to the Asian feature of the final settlement price (price based on composition/average). Option on futures have a mixture of European option on an Asian futures. Not all participants may have included all those features in their validation process. Even if this is a likely scenario to our opinion, this should not be a satisfactory explanation. As soon as their was doubt on the LIBOR long term viability (i.e. from July 2017), model validation for all LIBOR products should have been invalidated as the products term sheets had changed. Today's validation of LIBOR options on futures is even more complex than SOFR options due to the transition complexity and its still uncertainty (at which date the transition will take place, at which price - spreads are not multiple of 25 bps - , etc.)
  3. Play on non-transition: This may be the explanation for some trades, but we expect this to be very minor and would certainly not explain the increase of OI by more than 6 million quarterly contracts.
  4. Liquidity: Certainly liquidity is an important characteristic of futures and their options. But in this case, as there is a quite clear transition mechanism, market makers could offer liquidity in the SOFR version, knowing that they can still hedge perfectly (up to the small transition mechanism uncertainty) in the LIBOR versions. The liquidity issue may have been an impact at the start, but so far in the transition process, this does appear to us as a real obstacle.

For the sake on completeness on our weekly review, we add the usual futures graphs. Like in previous weeks the summary is: same as last week. No change in LIBOR, small increase in SOFR.

For the week ending 2022-02-18, the shares are: LIBOR-3M : 63.2%, SOFR-3M: 26.1%, EFFR-1M: 8.9%, SOFR-1M: 1.7%, BSBY: 0.1%.

Figure 4: STIR ETD futures daily volume (in thousands of contracts).

Figure 5: STIR ETD futures open interest (in thousands of contracts).

Tuesday, 15 February 2022

SOFR - 2022 week 6: still very slow progress

If USD-LIBOR could speak he would probably use the famous quote:

The news of my death is greatly exaggerated.

With six week into the new year that was supposed to be "no new USD-LIBOR", the situation appears to evolve very little. LIBOR is not the undisputed king of USD interest rate benchmark anymore, but is still largely present. SOFR, that was presented as the new king, fails to justify that reputation.

SOFR volumes is increasing, both in absolute and relative terms. The increase is undisputed, but it has not manage to overtake the two incumbents, LIBOR and EFFR, yet. Figure 1 represents the share of the different products cleared at LCH on a weekly basis since the start of 2022. Some SOFR increase is clearly visible, from 15% on week 1 to 19% on week 6, some LIBOR decrease from 42% to 31%, and the maybe unexpected EFFR increase from 40% to 45%. SOFR is still only bronze medalist in this 3-way competition. Moreover the LIBOR volume does not look like a pure "risk reduction" play. The outstanding amounts of USD-IRS at LCH has increased by 2,270 bn this week after a 1,695 bn increase last week.


Figure 1: Market shares for the different benchmarks at LCH in 2022

In absolute term, on a longer term horizon, there is a clear increase in SOFR volume as presented in Figure 2. In the last 6 months, the volume has increased from roughly 500 bn a week to 3,000 bn a week. Certainly a significant increase, but far from what was promised or expected by the "SOFR First" phases launched in the last 6 months.

Figure 2: SOFR volume in the last 9 months

If one looks at the ISDA figures (available here), representing the transactions disclosed under US regulation, the impression is the same: an increase of SOFR use, but still well below LIBOR.

The figures mentioned above are in term of notional. One could also look at the share in term of risk or DV01. This is what the Clarus RFR Adoption Indicator does. The increase is SOFR is visible also, but there also SOFR is far from being dominant. For January 2022, its share is 28.5%.

Some articles indicates that SOFR is taking over LIBOR in voume terms, in particular this Bloomberg article: SOFR liquidity eclipses LIBOR. It is based on trading activity on Bloomberg; it reports a 73% market share for SOFR. It would be interesting to understand why this subset of market activity favors SOFR why the general market does not.

The article provides also some very interesting information about bid-offer spreads. It says that (on Bloomberg platforms) the bid-offer for SOFR swaps is almost as narrow as spread for LIBOR swaps for 5, 10 and 30 years tenors. Our surprise is in the "almost". A 30-year LIBOR swap will be converted in less than 18 months into a SOFR swaps, using a not fully specified mechanisms and an still uncertain date. The fact that the LIBOR swap, which is an indirect SOFR swap with extra operational features (and risks), is trading at a narrower bid-offer than the original SOFR swap does not look to us as a positive sign for the market.

Nevertheless there is potentially an explanation for the narrower LIBOR bid/offer that still take into account the fact that LIBOR post-June 2023 is a transformed SOFR. Suppose that SOFR is the base market and that the LIBOR rates are simply computed from the SOFR curve using the ISDA fixed spread. Actually there is no "simply computed" mechanism, but a "model-dependent-and-subjectively-computed" mechanism as discussed before (see for example here or in our paper "ICE Swap Rate fallback: impact on swaption pricing"). We could have a situation where all market makers have SOFR swaps bid/offer narrower than LIBOR swaps but with different models to convert from SOFR to LIBOR rates, resulting in a market-wide bid/offer which is narrower for LIBOR. The model volatility will compress the wider individual bid/offers for LIBOR into a collective narrower bid/offer.

Plenty of quant work to understand all those issues.


On a related subject, IBA is launching its ICE Term SOFR rate in beta version. The existence of those Term rates are providing mechanism closer to the one provided by LIBOR with periodic term fixing and not overnight fixing. The market is slowly developing the tools to go back to LIBOR-like products, at least in operational terms, even if not in credit risk terms.


Don't hesitate to contact us if you want to review those or similar issues.