Monday, 27 December 2021

ESTR, SOFR and SONIA - end 2021

There have been a lot of discussions around ESTR, SOFR and SONIA over the last years. The interest rate derivative market was quite symmetrical between those currencies up to a couple of years ago. The market was dominated by one IBOR benchmark (EUR-EURIBOR, USD-LIBOR, GBP-LIBOR) with a decent overnight benchmark (EUR-EONIA, USD-EFFR, GBP-SONIA).

The three currencies have used different paths in their benchmark transition. On the overnight side, the GBP has changed the meaning of the overnight benchmark (April 2018) but has kept its name unchanged. The USD has created a new benchmark (SOFR, April 2018) and has kept the existing one (EFFR). The EUR has created new benchmark (ESTR, October 2019) and has at the same time changed the meaning of the old one (EONIA) and in a second time (January 2022) stopped the publication of the old one.

On the IBOR side, in GBP the LIBOR is declared non-representative from January 2022, will continue to exists to December 2022 in a synthetic form and its status for after January 2023 is still unknown. In USD, LIBOR is declared representative to June 2023, but new LIBOR trades should stop from January 2022; its publication will probably stop after June 2023. In EUR, EURIBOR will continue and there is not planned publication discontinuation.

On the volume side (as measured by interest rate derivatives cleared at LCH), if we consider only the above 3 currencies, the overall volume YTD for 2021 (IRS, OIS, basis, FRA, etc.) is split 52.5% for USD, 26.0% for EUR and 20.6% for GBP.

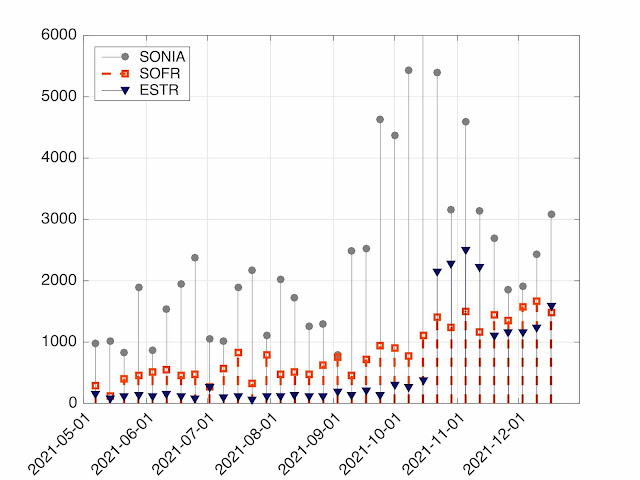
Looking only at the trades indexed on the new overnights (SOFR, ESTR, SONIA), one would expect a split where the EUR portion is inferior - EURIBOR continues - and a relative split between GBP and USD - both LIBORs should not be traded as of next week. What we see is very different. Taking only into account the last 8 weeks with published data at LCH, we have 24.0% for USD, 27.9% for EUR and 48.1% for GBP. The weekly comparison is provided in Figure 1. Even when compared with EUR, for which there is less overall volume and for which the IBOR will not stop, the SOFR volume is inferior. We are still far away from SOFR first. We will see what 2022 bring on that front.

Figure 1: Weekly volume for ESTR, SOFR, and SONIA linked derivatives at LCH (in USD billions equivalent).

Unfortunately, the volume for OTC trades on the other USD Credit Sensitive Rate BSBY are not available. For the futures, some figures were provided in a previous blog; USD SOFR First in numbers - 22 Dec 2021.

Saturday, 25 December 2021

Cash settled swaption pricing with Swap Rate Fallback - working paper

Swap Rate: cash settled swaptions in the fallback

Abstract

With the planned cessation of LIBOR, the LIBOR-based Swap Rates will also cease. For legacy transactions linked to it, a fallback is required. Some approximated fallback mechanisms have been proposed by working groups. The approximations involve some non-linear function of overnight-based swap rates. Due to the non-linearity, cash settled vanilla swaptions are becoming exotic products. Moreover, keeping the annuity unchanged while changing the rate to overnight-based swap generates technical issues in the pricing leading to convexity adjustments. The article proposes different pricing methodologies for those now exotic swaptions, including several price approximation to reduce the implementation numerical complexity.

Different working groups have proposed fallbacks for the Swap Rates indirectly based on the mechanism used for LIBOR itself. This is the case of the Sterling working group in Working Group on Sterling Risk-Free Reference Rates and the USD working group in ARRC (2021). Those fallbacks are based on OIS versions of the Swap Rates. IBA is publishing GBP SONIA ICE Swap Rate since 14 December 2020 and USD SOFR Swap rate since 8 November 2021. Refinitiv is publishing the Tona Tokyo Swap Rate since 28 October 2021.

For reasons summarised below, it is not possible to create a Swap Rate's fallback coherent with the LIBOR's fallback. Or more precisely it is possible (and easy) for a quant to do so, based on the swap market globally, but it is impossible for a lawyer in a definition involving a single number. The self-imposed restriction on the fallback type available make the existence of a coherent fallback impossible. In the absence of an exactly coherent fallback, the above mentioned working groups' documents tried to provide formulas for an approximatively coherent one.

In this paper we do not discuss the quality of the approximation — some discussions are available in one of Marc's blogs — but the impact of the type of fallback selected on a liquid vanilla market instrument: cash settled swaptions with collateral discounting.

The proposed replacement for GBP LIBOR ISR by the Working Group on Sterling Risk-Free Reference Rates (2021) is displayed in Figure 1. Formulas with similar mechanisms have been proposed for USD and JPY.

Figure 1. Approximated formula proposed by the WGSRFRR for ICE Swap Rate fallback.

After fallback, a cash settled swaptions with collateral discounting payoff becomes

The non-linear pay-off part of the problem will be decomposed in two issues: strike and exotic feature. As the rate is transformed by a non-linear function, finding at which OIS rate the former IRS swaption will be exercised requires a little bit of work: inverting the function f. Once the strike is known, there is the question of the payoff, which is given by the same non-linear function. It is not a vanilla swaption anymore; a simple strike's shift or multiplier is not enough. In our pricing approach we provide approximations that estimate the impacts of the different parts.

The swaption value is usually obtained by expectation in the IRS physical annuity associated measure. The two issues are the ``wrong'' annuity and the non-linearity f.

We first change the measure to the OIS physical annuity associated measure. Then we approximate the ratio of annuities by a function h of the OIS rate:

Using standard replication argument, the price can then be written as

The paper also proposes several approximation to the price by full replication. The approximations are based on simple change of strike, order 1 approximation and order 2- approximation. The approximation can be used for themselves in case of short term options. We use them mainly to clarify which issues have a significant impact on the price.

The replication formulas and all the approximations have been implemented in our production grade library.


Preliminary versions of the results were presented at The 4th Interest Rate Reform Conference (20-21 October 2021) and at The 17th Quantitative Finance Conference (17-19 November 2021). 

The full paper has been submitted for publication in November.


Don't hesitate to contact us if you want to implement such approach or validate your own implementation.


Happy New Year

Wednesday, 22 December 2021

USD SOFR First in numbers

Over the last 5 months, several "SOFR First" dates have been initiated by US regulators. With the January 2022 date approaching, this post review were we stand on this issue for the two main source of liquidity in the interest rate market: swaps and futures.

The post is based on public data from LCH, ISDA and CME for futures.

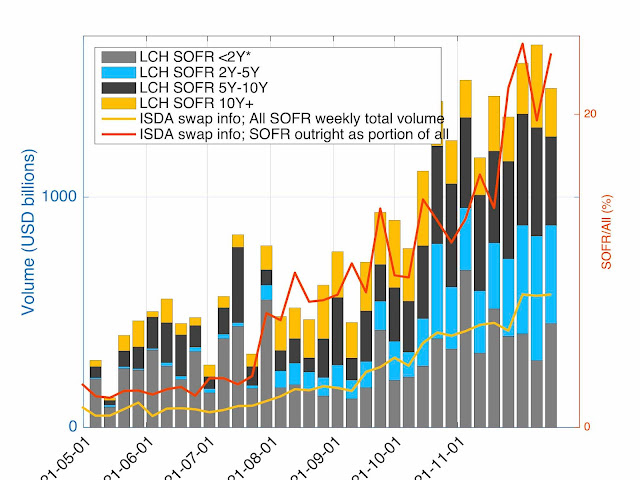
On the swap side, the SOFR portion in volumes continue to increase. The volume is now above 1,000 billion a week every week. But the increase is not spectacular. From the ISDA figures, it appears that a couple of weeks before the theoretical deadline, we are roughly at LIBOR 75% - SOFR 25%.

Figure 1: SOFR - LCH volumes and ISDA reported volumes

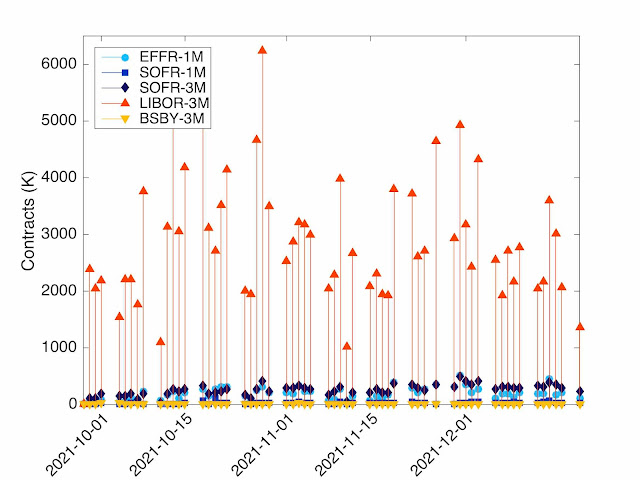
On the futures side, the transition is even less spectacular as reported in Figure 2. There the situation is (over the last month) LIBOR 83% - SOFR 10% - Fed Fund 7%.

Figure 2: LIBOR and overnight futures at CME. Daily volume (in thousands).

From our perspective, it is difficult to understand where this is coming from as by trading futures with maturity beyond June 2023, one effectively trade a SOFR futures under a different name. A financial reason that may warrant such trade is the expectation that the transition will not take place and hope for a larger/smaller spread that the one implied by the CME announced conversion mechanism. But such an explanation for a so large volume does not appear realistic. Maybe a more down to hearth explanation is that the market is not ready from a system, back office, validation or limit prespective. The users trade LIBOR futures, even if they are convinced that they are SOFR futures under another name, because they are not allowed to trade SOFR futures directly.

The slow transition of the eurodollar futures as been also reported in the press. See "SOFR First" for Eurodollars downgraded to "best practice".

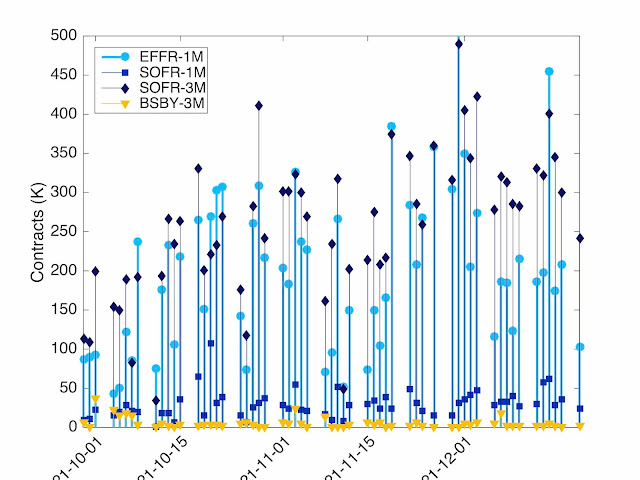
Even for overnight futures, the SOFR futures are not the only player as reported in Figure 3. The Fed Fund futures still trade in a large volume. On the one-month futures side, the Fed Fund futures volume is well above the SOFR futures.

Figure 3: Overnight futures at CME. Daily volume (in thousands).

The futures graphs also provide some figures for the BSBY futures. The volume is present, but an order of magnitude or two below the SOFR futures (0.1% of total futures volume in the last month). This reinforce our opinion that the continued trading of LIBOR futures is a sign of lack of market readiness in the transition. Trading of LIBOR futures is not trading bank funding, that would be better done through BSBY futures; trading of LIBOR futures is not trading monetary policy, that would be better done through SOFR futures. What appear to be traded in LIBOR futures is the "inertia" of the market, the difficulty inherent in changing or discontinuing something that has been at the core of the interest rate market since the 80's.

Saturday, 11 December 2021

USD benchmarks and spreads

With a couple of weeks left to the LIBOR big crunch, we review the market situation in term of "spreads".

There has been a push to not only correct the LIBOR weakness but also from certain quarter to try to kill the idea of credit sensitive benchmarks. With many trillions of financial instruments referring to credit sensitive benchmarks and LIBOR in particular, the impact of removing the credit sensitivity is, on a gross basis, many trillions multiplied by many basis points, i.e. a huge amount. That huge amount is the so-called value transfer in the transition.

In this blog we don't try to estimate the "many trillions" part, but to review with actual market data the order of magnitude of the "many basis points" part.

The USD market is both the largest financial market and the one where more benchmarks related to those issues are publicly available, so we focus on that market.

Some of the available benchmarks are:

  • SOFR: Secured Overnight Financing Rate, a secured overnight rate published by the New York Federal Reserve.
  • LIBOR: London InterBank Offered Rate, and unsecured term rate published by IBA. Its CHF, GBP, and JPY version will stop publication on 2021-12-31. Its USD version will stop publication on 2023-06-30, but to some extend its use for new trades will be forbidden as soon as 2022-01-01.
  • AMERIBOR: There are several version of it, and here we focus on the 30-day term rate with ticker AMBOR30T
  • Bloomberg BSBY: Credit sensitive term benchmark based on actual bank funding transactions.
  • IBA BYI: Bank Yield Index. To some extend similar to BSBY but only in beta version at the moment.

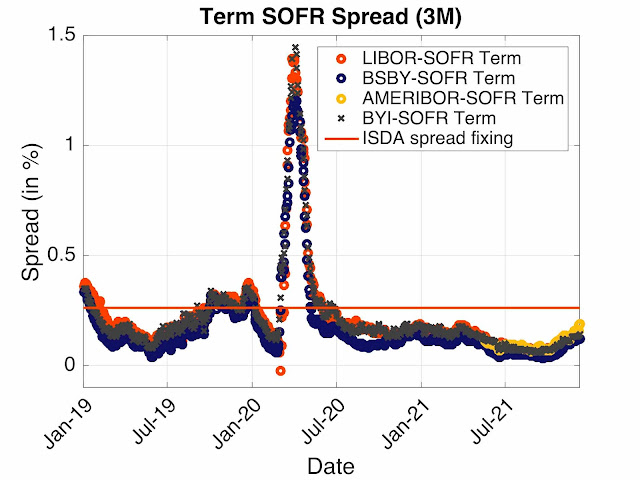
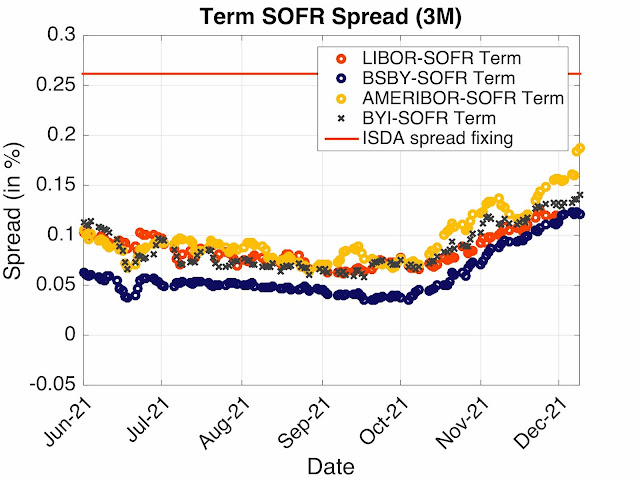
LIBOR rates have been accused to be manipulated, probably with reason in the first 10 years of the millennium. If manipulation was the problem, one could simply have reformed them instead of discontinuing them. Are LIBOR rates still manipulated? Figure 1, tends to lead to a "no" answer. It displays LIBOR and different other indices, most of them IOSCO principles and BMR compliant, that promise to represent the same bank cost of funding. Through the recent Wuhan born pandemic and Fed provided liquidity flooding, the appearance is the same: the different indices are at very similar levels and move in sync. No sign of major manipulation is visible.

Figure 1: Historical data for different spreads.

To deal with the forced LIBOR disappearance, an artificial fallback mechanism has been created. It relies on a fixed spread between some measure of SOFR on the LIBOR tenor and LIBOR itself. That spread is fixed and unique for each LIBOR index. What has been the behaviour of the actual spread in the market over the last years? All time series represent the spread between the above mentioned indices and term SOFR. The ISDA proposed spread, copied by CCPs, regulators, and lawmaker is displayed in red. Both in case of crisis and the recent data, this fixed spread has been far away from a bank funding level fair representation.

In Figure 2, we focus on the last 6 months. The proposed spread has clearly been 10 to 15 basis points too high. Actual lending have reflected this reality, with spread to SOFR well below LIBOR spread if the artificial spread is used as a reference.

Figure 2: Historical data for different spreads, last 6 months.

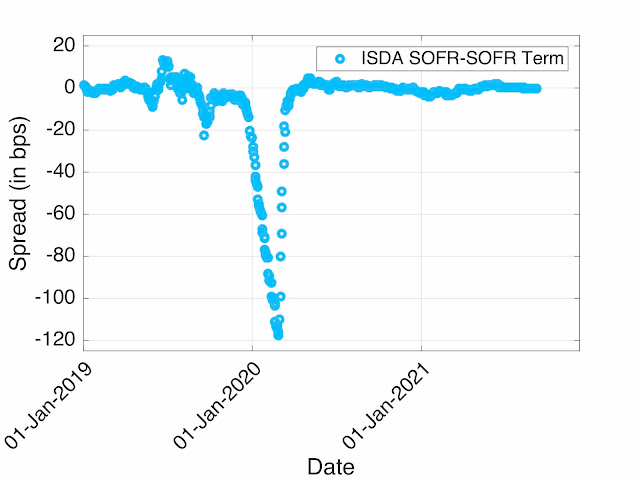
The spread has been computed as the 5-year median between LIBOR in advance and SOFR in arrears. So it includes the credit/liquidity term spread but also the in-arrears/in-advance spread, i.e. the misestimation by the market of the short term (next 3 months) monetary policy. The impact of that misestimation is displayed in Figure 3. The pandemic induced rate cut has created a significant (up to 120 bps) misestimation; that misestimation is embedded in the computed spread.

Figure 3: Historical data for the spread between ISDA SOFR 3-month methodology and ARRC recommended SOFR 3-month term rate.

Is this analysis relevant or just a theoretical computation without practical impact? This spread is used for 100 trillions of financial products. From a risk management point of view, the important figure is Figure 1. The change of benchmark impairs the risk management features by as much as 100 basis point, certainly a non-negligible level. For some this may be an improvement, but certainly it is not an impact-less transition. From a valuation perspective, the important point is the expected value of the changes. The spread as been computed as median — not a mean —, so there is no a priori relation between the figure used and the actual valuation impact, even if the spread figure was computed properly. In practice the difference is, for USD-LIBOR-3M, a median of 26.161bps ("official" figure) and a mean of 32.583 bps. That is more than 6 bps between the two. If the "technical" choice done by ISDA and its member had been "mean", you would be richer (or poorer) by 6 bps on all your USD-LIBOR-3M payments for the rest of times!

In between the "wrong" rate (in-advance/in-arrears) and the wrong statistical measure (mean/median) there is a lot that can go "wrong" from a value transfer perspective. Looking at the issue from different perspectives, you can certainly find different answers. But in all cases, a realistic order of magnitude is around 10 basis points.


All those issues do not stop on 1 January 2022. The impacted trades may stay in the books for many years or may have been amended in an unfair way. Some items to keep in mind:

  • the management of the fallback process is extremely complex, even with a fixed spread (see here),
  • the spread fixing mechanism/protocol may have been done incorrectly and you need to claim some compensation (see here)
  • the impact on non-linear products is more complex than a simple spread change (see here)
  • EU regulation forces the use of "in-advance" fixing for CHF LIBOR, with potentially significant convexity adjustment impacts
  • CCP transition is not equivalent to bilateral transition, back-to-back trade may not be back-to-back anymore

This is only a small list of potential issues. Don't hesitate to contact us for advice on those and related issues. Better safe than sorry; a couple of days worth of advice can save you years and millions in litigations or financial losses.

Wednesday, 10 November 2021

Volume in overnight-indexed derivatives

ESTR

With the disappearance of EONIA (at least in the cleared world), ESTR continues in line with previous weeks.

SOFR

SOFR also continues to progress. But still below 15% of the IR derivatives (as reported by ISDA Swap Info) and far away from SOFR first.


On Monday (2021-11-08), IBA launched the USD SOFR ICE Swap Rate.

SARON

CHF-LIBOR is disappearing in roughly 6 weeks. SARON, its only competitor, continues to progress slowly. We would not say it is a complete victory yet.


USD futures

On the Exchange Trade (Futures) side, LIBOR is still the USD leader, by a wide margin.

If we zoom in on the alternatives, we see a host of other contract types. Beyond SOFR, there is EFFR, BSBY and AMERIBOR. The good old Fed Fund futures (1 month, arithmetic average) is still the most traded contract after LIBOR on some days. The volumes for BSBY and AMERIBOR are significantly smaller by not completely negligible. They also help to assess the value transfer embedded in the LIBOR fallback.

LIBOR contract beyond July 2023 will be converted in SOFR-3M futures in June 2023. Still more liquidity in the LIBOR futures than in SOR futures even after July 2023. Why? Two hypothesis: one not good for the state to the financial industry and one not good for the state of the transition.

Hypothesis 1: Financial institution not ready for SOFR futures. This can be due to valuation and risk (SOFR futures have a different convexity adjustment and a different apy-off) or operational (settlement is at the end of the period, based on compounded rate) issues. Trader would use LIBOR futures because their institution cannot cope with SOFR futures, even if they know that they are not really trading LIBOR futures. They hope than in the next 18 months their institution will be ready, but clearly they are not ready yet.

Hypothesis 2: Trader have a very good understanding of the issue but believe that there is still a chance that USD-LIBOR will not stop at end of June 2023. The LIBOR futures are trading at the ISDA/Bloomberg spread to SOFR futures. They can be seen as a free option on the non-cessation. If everything goes as planned by regulators/IBA, no loss; if cessation is postponed, a big profit (if the position is in the right direction). But that would be a one sided bet, who is taking the opposite direction? People certain of the transition? People not aware of uncertainty in the transition? People not aware of the transition?

I don't know which of the two is true or if a third hypothesis should be incorporated.

SOFR is certainly taking some volume from USD-LIBOR. But BSBY is also coming to life. A little bit of volume on the futures side (7,500 ADV or so) and commitment by the two main USD Swap clearing houses (CME and LCH) to start clearing BSBY IRS by year end. The USD Game of Benchmark is on, now more than ever.

Tuesday, 26 October 2021

SOFR and ESTR: a real boom?

Over the last months, our analysis in relation to ESTR and SOFR has been something like "small improvements".

This week the summary could be: a real boom!

The situation is very different in USD-SOFR and in EUR-ESTR, even if the result are similar.

ESTR

Let's start with the EUR-ESTR. EONIA has been the main overnight benchmark up to recently even if EONIA is derived from ESTR as ESTR+8.5 bps since October 2019. In two years, the real underlying had not been able to overtake the old and broken incumbent. EONIA will stopped to be published as of 1 January 2022.

On 15 October, the CCPs have cancelled the existing EONIA swaps and replaced them by ESTR swaps. No more EONIA swaps at CCPs but many ESTR swaps. This is clearly visible in the graph below (LCH volumes).

Note that at almost the same time (on 21 October), the EU published a text of law mandating the replacement of EONIA by ESTR + 8.5 bps. When it was announced that EONIA data collection would be stopped (somewhere in 2018) and replaced by ESTR + spread, Marc said that he believed that the synthetic EONIA would last for very long. He was quickly proven wrong with the announcement that EONIA publication would be stopped on 1 January 2022.

Now he is proven right again by the law! Three years were no enough to deal with this transition. This is in line with another (even older) prediction: Change of benchmark overnight index is a difficult task. Another prediction was that EONIA would stay for a very long time in bank systems as a fixing and as a curve. Note that the EONIA replacement by ESTR+8.5bps is only for contracts for which the EU law applies.

SOFR

For SOFR, there was no specific news, but a real progress in term of volume nevertheless.

A significant increase in absolute volume both at LCH and in the ISDA figures (US regulatory figures). The relative volume is still below the 15% of the total LIBOR + SOFR. The USD market is still far away from SOFR first!

Wednesday, 13 October 2021

ICE Swap Rate fallback: impact on swaption pricing

Sterling and dollar working groups have proposed fallback for ICE Swap Rates (ISR) based on the mechanism used for LIBOR itself. It is not possible to create a ISR's fallback coherent with the LIBOR's fallback. Or more precisely it is possible (and easy) for a quant to do so, based on the swap market globally, but it is impossible for a lawyer in a definition involving only one number published on a single screen.

The self-imposed restriction on the type of fallback available make the existence of a coherent fallback impossible. In the absence of an exactly coherent fallback, the working groups tried to provide an approximately coherent one.

The impacts of those fallback go beyond simply printing a formula on a piece of paper and have profound impacts on the valuation and risk management of existing instruments like swaptions.

In particular cash settled swaptions with collateral discounting have a triple problem:

  • Incoherent spread (delta hedge with swaps)
  • Non linear pay-off
  • ``Non-natural'' annuity, i.e. convexity adjustment

The incoherent spread was discussed by Marc in a previous blog: LIBOR transition: How to lose money, automatically!

In a forthcoming paper, we will show how those swaptions can be priced.

The one line summary of the pricing method is a change of strike in line with the non-linear rate transformation and a replication similar to the one used in CMS pricing.

Some early results have been presented in LIBOR transition workshops. A more detailed seminar related to the swaption pricing will be presented at The WBS 17th Quantitative Finance Conference.

Below we already proposed a graph that displays the non-linearity impact, the exact meaning of which will be discussed in the seminar. We will post a link to the full paper once published.


Note added 20 October 2021: A preliminary version of the results were presented at The 4th Interest Rate Reform Conference today.

Note added 20 October 2021: I have added the ICE Swap Rate fallback formulas to my open source library muRisQ-ir-models at https://github.com/marc-henrard/muRisQ-ir-models/blob/master/src/main/java/marc/henrard/murisq/pricer/generic/FallbackIsrUtils.java.

SOFR volume to 8 October 2021

Usual review of SOFR volumes. After a small increase a couple of weeks ago that lead us to ask "Is something happening?", we are back to levels below mid-July level at LCH. ISDA figures indicate that SOFR is back to less than 10% of interest rate derivatives volume.

No real progress a little bit more than two months before the expected deadline for "no more LIBOR".

Short term swaps (less than 2Y) volume is not increasing either, which is not a good indication for the development of Term SOFR rates.

Tuesday, 28 September 2021

SOFR: Is something happening?

Weekly volumes of interest rate trades. Is SOFR slowly waking-up? Weekly volume last week are the highest ever, higher than mid-July. ISDA reported figures (US only) have the highest percentage of SOFR outright volume (almost 14%).

The ISDA data (representing data reported to US regulators) is growing faster than the LCH data (international markets). Does it means that international users are slower to move to SOFR and that we could have two markets: a local market (with local regulatory pressure) and an international market (with more market freedom)?

Note that we have change the definition of relative portion in the graph. The outright SOFR is now reported as portion of all trades, not portion of LIBOR trades. This is to avoid "infinite" results when LIBOR will disappear. The portion is now capped at 100%.