Tuesday, 15 February 2022

SOFR - 2022 week 6: still very slow progress

If USD-LIBOR could speak he would probably use the famous quote:

The news of my death is greatly exaggerated.

With six week into the new year that was supposed to be "no new USD-LIBOR", the situation appears to evolve very little. LIBOR is not the undisputed king of USD interest rate benchmark anymore, but is still largely present. SOFR, that was presented as the new king, fails to justify that reputation.

SOFR volumes is increasing, both in absolute and relative terms. The increase is undisputed, but it has not manage to overtake the two incumbents, LIBOR and EFFR, yet. Figure 1 represents the share of the different products cleared at LCH on a weekly basis since the start of 2022. Some SOFR increase is clearly visible, from 15% on week 1 to 19% on week 6, some LIBOR decrease from 42% to 31%, and the maybe unexpected EFFR increase from 40% to 45%. SOFR is still only bronze medalist in this 3-way competition. Moreover the LIBOR volume does not look like a pure "risk reduction" play. The outstanding amounts of USD-IRS at LCH has increased by 2,270 bn this week after a 1,695 bn increase last week.


Figure 1: Market shares for the different benchmarks at LCH in 2022

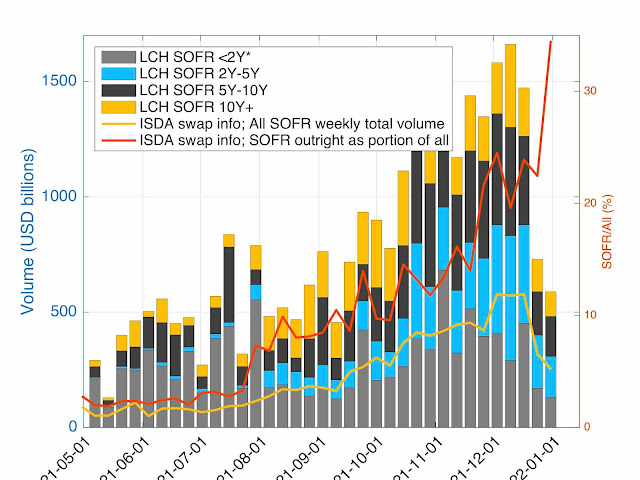
In absolute term, on a longer term horizon, there is a clear increase in SOFR volume as presented in Figure 2. In the last 6 months, the volume has increased from roughly 500 bn a week to 3,000 bn a week. Certainly a significant increase, but far from what was promised or expected by the "SOFR First" phases launched in the last 6 months.

Figure 2: SOFR volume in the last 9 months

If one looks at the ISDA figures (available here), representing the transactions disclosed under US regulation, the impression is the same: an increase of SOFR use, but still well below LIBOR.

The figures mentioned above are in term of notional. One could also look at the share in term of risk or DV01. This is what the Clarus RFR Adoption Indicator does. The increase is SOFR is visible also, but there also SOFR is far from being dominant. For January 2022, its share is 28.5%.

Some articles indicates that SOFR is taking over LIBOR in voume terms, in particular this Bloomberg article: SOFR liquidity eclipses LIBOR. It is based on trading activity on Bloomberg; it reports a 73% market share for SOFR. It would be interesting to understand why this subset of market activity favors SOFR why the general market does not.

The article provides also some very interesting information about bid-offer spreads. It says that (on Bloomberg platforms) the bid-offer for SOFR swaps is almost as narrow as spread for LIBOR swaps for 5, 10 and 30 years tenors. Our surprise is in the "almost". A 30-year LIBOR swap will be converted in less than 18 months into a SOFR swaps, using a not fully specified mechanisms and an still uncertain date. The fact that the LIBOR swap, which is an indirect SOFR swap with extra operational features (and risks), is trading at a narrower bid-offer than the original SOFR swap does not look to us as a positive sign for the market.

Nevertheless there is potentially an explanation for the narrower LIBOR bid/offer that still take into account the fact that LIBOR post-June 2023 is a transformed SOFR. Suppose that SOFR is the base market and that the LIBOR rates are simply computed from the SOFR curve using the ISDA fixed spread. Actually there is no "simply computed" mechanism, but a "model-dependent-and-subjectively-computed" mechanism as discussed before (see for example here or in our paper "ICE Swap Rate fallback: impact on swaption pricing"). We could have a situation where all market makers have SOFR swaps bid/offer narrower than LIBOR swaps but with different models to convert from SOFR to LIBOR rates, resulting in a market-wide bid/offer which is narrower for LIBOR. The model volatility will compress the wider individual bid/offers for LIBOR into a collective narrower bid/offer.

Plenty of quant work to understand all those issues.


On a related subject, IBA is launching its ICE Term SOFR rate in beta version. The existence of those Term rates are providing mechanism closer to the one provided by LIBOR with periodic term fixing and not overnight fixing. The market is slowly developing the tools to go back to LIBOR-like products, at least in operational terms, even if not in credit risk terms.


Don't hesitate to contact us if you want to review those or similar issues.

Wednesday, 9 February 2022

USD STIR futures in 2022: LIBOR unchanged, SOFR gaining some traction

We continue our review of USD market volumes with STIR futures (CME volumes).

The one line summary is: LIBOR unchanged; SOFR gaining traction but still far from LIBOR.

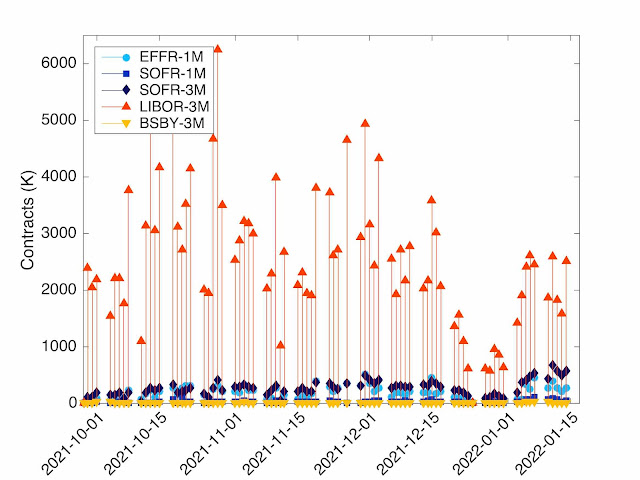
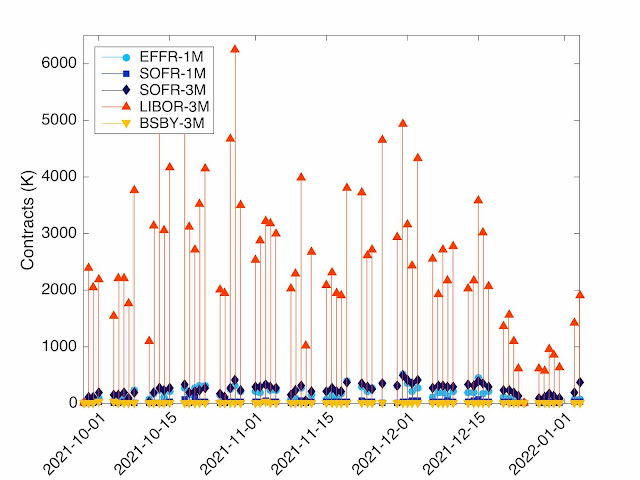
The figures for week 5 are (with last week in parentheses) LIBOR-3M 68.1% (69.3%), SOFR-3M 20.5% (19.6%), EFFR-1M 9.8% (10.1%), SOFR-1M 1.4% (1.0%), and BSBY-3M 0.1% (less than 0.1%). The daily figures up to yesterday 8 February are reported in Figure 1.

Figure 1: STIR futures daily volume at CME.

The trend observed this year are still there: very gradual reduction of LIBOR, significant gains in SOFR and gains in Fed Funds. BSBY remains very marginal.

If we exclude the LIBOR part, we have the picture displayed in Figure 2. Clear increase of volume for SOFR and EFFR. SOFR dominates that space but in an "unfair" competition contest. EFFR is only 1-month futures and limited to contract up to one-year expiries; SOFR has 1-month and 3-month futures and extends up to 6-year expiries.

Figure 2: STIR futures daily volume excluding LIBOR futures.

The Open Interest (OI) picture, provided in Figure 3, confirms that analysis. Since the 31 December 2021, the LIBOR futures are almost unchanged in OI (-1.9%). The ED volume is not "risk reduction" only. The SOFR-3M futures OI has increased by 77%, SOFR-1M by 42% and EFFR by 29%. In the graph, we have indicated the 31 December OI with the dotted lines for LIBOR and SOFR-3M. The BSBY OI has increased significantly on a relative basis, by 35%, but from a very low starting figure and is still very marginal.

Figure 3: STIR futures Open Interest.

Tuesday, 8 February 2022

2022 Week 5 - Decrease in SOFR volume!

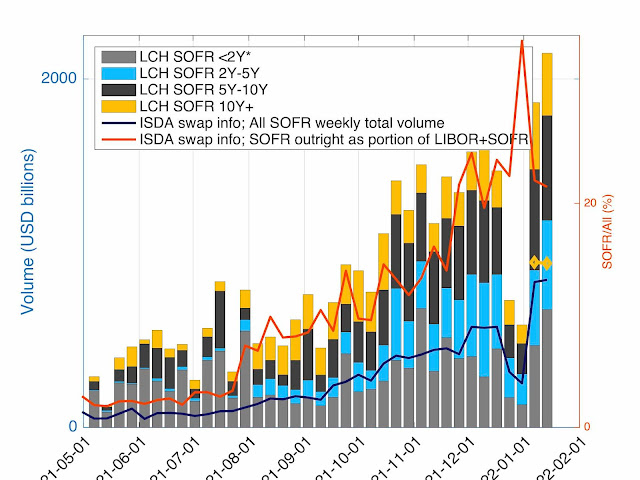
In absolute terms, the volumes of LCH cleared SOFR swaps and ISDA reported SOFR derivatives have decrease in week 5 with respect to week 4. The figures are reported in Figure 1 below. This is in a week where interest rate market have seen some volatility that usually is conductive of higher volume. As a comparison, the LCH EUR and GBP volumes have both been more than 50% higher that the average of other weeks this year and the ESTR volume has more than doubled with respect to the previous week.

Figure 1: OTC SOFR volume and share of SOFR

In relative terms, OIS-EFFR is at 44.8% down from 47.9%, IRS-LIBOR is at 31.2% slightly up from 31.0%, and OIS-SOFR is at 19.7% up from 15.9% (plus some basis, FRA, inflation). The OIS-SOFR share is represented by the yellow curve (right axis). The order EFFR-LIBOR-SOFR has not changed since week 2. 

In absolute terms, the outstanding volume for USD-LIBOR-IRS has increased by 1.6 trn, to 81.2 trn from 79.5 trn. The LIBOR activity does not seem to correspond to a volume reduction. Nevertheless, there is the possibility that the new volume corresponds to shorter maturities, e.g. pre-June 2023 matuties, and are reducing the real LIBOR risk but does not lead to an outstanding volume reduction due to the way cancellations happen at CCP. The cancellations (blended coupons) take place only for perfectly date matching swaps, not for matching legs or coupons. 

For comparison, we propose the EUR-ESTR volume in Figure 2.

Figure 2: OTC ESTR volume at LCH

Note the jump in volume over last week. Also of interest is the large short maturities (<2Y) share. A similar effect is not visible in USD-SOFR. Probably due to the large EFFR share in USD which may concentrate a good part of the short term trading activity. Large EFFR activity is also visible in the futures market; the futures activity will be discussed in a forthcoming blog.

Tuesday, 1 February 2022

SOFR after the fourth week of 2022: slow progress, still "SOFR "Third" for OTC

There is some progress on SOFR volume, but still very slow.

The OTC Cleared at LCH side still reports a "SOFR Third" week. With respect to the first two weeks of January, the two next have seen an increase in global volume. The increase comes mainly from an increase in EFFR volume. In relative terms, OIS-EFFR is at 47.9% up from 41.9%, IRS-LIBOR is at 31.0% down from 37.7%, and OIS-SOFR is at 15.9% up from 14.6% (plus some basis, FRA, inflation). The OIS-SOFR share is represented by the yellow curve (right axis). The order EFFR-LIBOR-SOFR has not changed since week 2. See Figure 1 for the representation of those numbers. In absolute numbers, SOFR is also up.

Figure 1: OTC SOFR volume and share of SOFR

Note that the ISDA figures reports only LIBOR and SOFR (in particular not EFFR) and is based on US regulatory figures, which is well below LCH figures. Related to the meaning of the different figures, one has to be careful when comparing them. CCP figures are "double counted" in the sens that one bilateral trade is novated to the CCP as two trades (the CCP with each of the counterparties). If all cleared trades and only them were reported in the ISDA figures, one should expect them to he half of the CCP figures. We will try to update our data source to cover more products and details in forthcoming blogs.

January was supposed to be the end of USD-LIBOR trading (with the fixing published to June 2023). From the above data, it is clearly not the case. The increase in EFFR share is interesting. The "shift in liquidity" is from LIBOR but not all to SOFR, as a large share of the shift goes to EFFR. Also LIBOR-FRA have decrease significantly. This may be an impact of the expected fallback which pushes participants to trade single period swaps instead of FRAs. The IRS-LIBOR figures may be inflated by this change of market convention. There is no indication in the available data about the maturity of the trades. On a DV01 basis the picture may be different.

On the STIR futures at CME side, there is a "shift in liquidity", but still very slow. The figures are LIBOR-3M 69.3%, SOFR-3M 19.6%, EFFR-1M 10.1%, SOFR-1M 1.0%, and BSBY-3M less than 0.1%. The open interest ED has increased by 106K since 31 Dec (from 11,237,037 to 11,343,681), so the ED volume is not all "risk reduction"

Figure 2: Daily STIR futures volume at CME


We have also added a graph with STIR Futures volume, excluding the ED futures. It shows clearly the volume increase for both SOFR and EFFR and the stagnation in BSBY.

Figure 3: Daily STIR futures volume at CME, non-ED futures.

On the SOFR futures side, it is interesting to note that option have started to trade. They have been available to trade for some time, but only since the begining of 2022 some liquidity has appeared.

Wednesday, 19 January 2022

SOFR in the second week of 2022: slow progress, still "SOFR Third" for OTC

A quick look at the OTC and ETD sides of SOFR for the second week of 2022.

The OTC Cleared at LCH side still reports a "SOFR Third" week. The major change since last week has been the change in First, now going to EFFR slightly ahead of LIBOR. SOFR's share has slightly decrease from 14.8% down to 14.6%. The figures are: OIS-EFFR 41.9%, IRS-LIBOR 37.7% and OIS-SOFR 14.6% (plus some basis, FRA, inflation). We have added the SOFR share at LCH in Figure 1 as the yellow lines (only for 2022 as we have not collected the relevant data in 2021).

Note that the ISDA figures report only LIBOR and SOFR (in particular not EFFR) and is based on US regulatory figures, which is well below LCH figures (dark blue line in the graph, around 30% of LCH volume). The SOFR share around 20% reported by ISDA is inflated due to the absence of the EFFR volume.

Figure 1: OTC SOFR volume and share of SOFR

On the STIR futures at CME side, there is a "shift in liquidity", but still very slow. The figures are LIBOR-3M 69.7%, SOFR-3M 18.5%, EFFR-1M 9.4%, SOFR-1M 2.2%, and BSBY-3M 0.2% as displayed in Figure 2. The open interest for ED has increased by 235K since 31 Dec (from 11,237,037 to 11,472,753), so the ED volume is not "risk reduction". The shares in volume have to be compare with previous shares; if we look at the December figures, we had LIBOR-3M 81.3%, SOFR-3M 10.8%, EFFR-1M 6.5%; SOFR-1M 1.1%, and BSBY-3M 0.2%. Like in the OTC case, the increase in EFFR share is interesting. The "shift in liquidity" is from LIBOR but not all to SOFR, as a large share of the shift goes to EFFR.

Figure 2: Daily STIR futures volume at CME

Some news in other currencies at LCH:

EUR:

EURIBOR still largely dominant with EURIBOR (IRS+FRA) at 79.1% and ESTR-OIS at 18.5% (plus some basis and inflation).

GBP:

Still some LIBOR trades (from swaption exercise), but now at 0.02% of the market! SONIA at 95.7% and inflation at 4.2%.


See also our post related to the 2022 first week: First week of 2022 at LCH - another "SOFR Third" week.

Monday, 10 January 2022

First week of 2022 at LCH - another "SOFR Third" week

One week in the new year. One week where it is recommended not to use USD-LIBOR for OTC derivatives. From the figures published by LCH, this is far from being the case. This is not dissimilar to what is happening with the futures, as described in a previous blog: SOFR Futures: LIBOR dominates!

The OTC derivatives podium, from Gold to Bronze, is LIBOR IRS 41.3%, EFFR OIS 39.8% and SOFR OIS 14.8% (the rest is basis, LIBOR FRA and inflation). Even in the OIS category, SOFR is less than one third of the market.

The absolute figures for SOFR are provided below. The ISDA Swap Info for the first week of 2022 was not available at the time of writing this blog.

Saturday, 8 January 2022

SOFR Futures: LIBOR dominates!

The title of the post may look like a typo, but it is not. For the first days of the year, among the STIR futures settling against SOFR, the ones with a LIBOR name still dominate. The post-June 2023 LIBOR futures will be converted around June 2023 into SOFR futures (with a known spread of 26.161 bps). The final settlement of those is thus SOFR based, even if they still have a name with Eurodollar LIBOR.

The total volume for STIR futures at CME was for the first week of 2022, 75.1% for LIBOR (3M), 14.2% for SOFR (3M), 8.1% for EFFR (1M), 2.1% for SOFR (1M) and 0.5% for BSBY (3M).

But if we are looking only at the post 2023 futures, they all are SOFR (3M) delivery futures (except a couple of hundreds trades on BSBY). For those trades, the LIBOR futures had yesterday (2022-01-07) a volume of 91.1% (trades up to Dec 2028) and the SOFR futures a volume of 8.9% (trades only up to Dec 2027). Hence the oxymoronic title to this blog.

The LIBOR volume does not correspond to risk reduction as the LIBOR Open Interest have increased by 100,000 contracts since 31 December 2021.

We don't know why such a trading pattern exists, but we conceive that it could be a way to hide the complexity of the new product behind an old name.

Note that on the cleared side, LCH indicates for the first week of 2022 43% IRS (LIBOR) and 57% OIS (SOFR and EFFR). The split between SOFR and EFFR is not published yet but it looks very likely that we are not yet at SOFR First.

Wednesday, 5 January 2022

USD STIR Futures in 2022

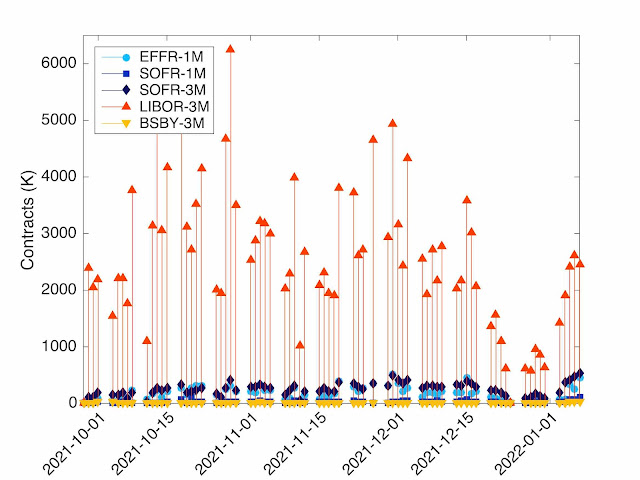
On the STIR Futures side for the first two days of 2022, LIBOR still dominates as shown in the graph below. LIBOR futures are around 81% and SOFR futures (1M + 3M) at 15.5% (the rest is EFFR 3.2% and BSBY 0.2%).

What is interesting also on the LIBOR futures side is that the split between the pre-June 2023 and post-June 2023 is roughly 50/50. Even for the post-June 2023, LIBOR is still the dominant futures, even if LIBOR will not exist anymore at that date. The market prefers to trade LIBOR futures that are planned to convert into SOFR futures to trading the SOFR futures directly.

The transition from LIBOR futures to SOFR futures is far from being trivial from a risk management and model validation perspective. There are at least three elements that should be validated before continuing trading the LIBOR futures with post-June 2023 expiry.

  • Fallback: trading post-June 2023 expiry rely on a fallback procedure. The fallback will convert LIBOR futures into SOFR futures with a price adjustment at an uncertain date (the date for GBP-LIBOR futures was mid December 2021). That procedure needs to be validated.
  • Convexity: The convexity adjustment between forward and futures is not the same for LIBOR and SOFR futures. In the LIBOR case, there is an extra market quantity, the spread between LIBOR and SOFR (used for forwards collateral); in the SOFR case, the payoff is of Asian type with the final settlement at the end of the period based on some average (composition).
  • Tenor: The LIBOR futures are based on LIBOR-3M with standard tenor convention (modified following); the SOFR futures are based on IMM dates and can have tenors between 12 and 14 weeks.

If you are trading LIBOR futures or SOFR futures, maybe a new model validation for the valuation and risk management of those instruments would be appropriate. If this is the case, don't hesitate to contact us. We have researched, published articles and developed related libraries. We can provide a rapid access to the foundations required to the assessment and validation of those market changes.

SOFR - LIBOR / Last weeks of 2021 + first days of 2022

2021 came to an end. What about LIBOR and SOFR?

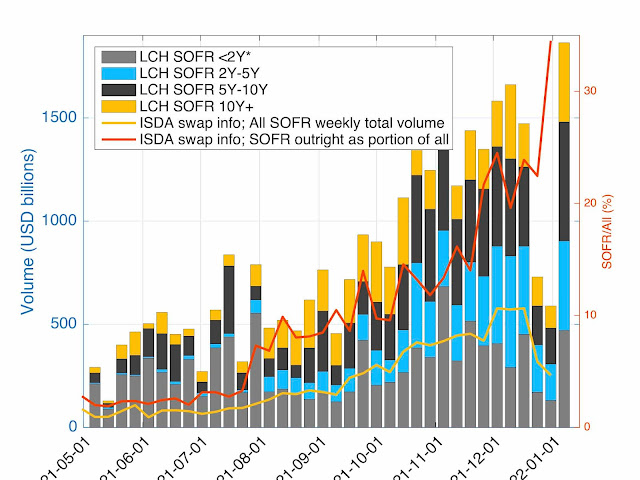
SOFR certainly did not come to an end. The volumes continue to increase. LIBOR did not come to its end either. On the week before its announced demised, it still dominate the USD interest rate market.A couple of days ago, we published some figures for the USD STIR futures at CME. LIBOR was still around 80% of the market and SOFR coming second with around 14%.

LCH and ISDA have now published their numbers for the last week of 2021.

As expected, over the last 2 weeks of the year the general transaction volume was a lot lower than in the previous weeks. This is reflected in both LCH and ISDA figures. On a relative basis, SOFR is now in the ISDA figures (US regulatory figures) at around one third of the market. Still not at the SOFR First mark, but coming closer. It is difficult to assess if this is a US only effect or a global effect.

Early 2022 figures at LCH indicate that OIS (SOFR and EFFR) is around 72% of the market while IRS (LIBOR and BSBY?) is around 23% (the rest is basis, LIBOR-FRA, inflation). The split between SOFR-OIS and EFFR-OIS is not published on a daily basis. We will have to wait the weekly statistics to see it. But there are early indication that this week could be the first week of the real "SOFR First" for the cleared market.

Monday, 3 January 2022

USD Rate Futures: LIBOR still dominates!

The end of year numbers indicate that LIBOR is still by far the dominant short term interest rate (STIR) futures (at CME).

Over the last week of 2021, which is supposed to be the last week of LIBOR we have LIBOR 3M 79.1%, SOFR 3M 13.1%; EFFR 1M 6.2%, SOFR 1M 1.0% and BYSBY 3M 0.6%


Early trends for the first business day of 2022 indicate a 2022 start similar to the 2021 end.